Projections of the Ebola epidemic in Guinea and Sierra Leone at the county level
Compiled up to 26 July 2015
Executive summary
- We use a combination of WHO and SitRep data to obtain reliable and up-to-date time series of the number of confirmed & probable cases.
- We fit our model on the 5 districts with the most active transmission over the past 3 weeks.
- We also fit our model to the number of confirmed and probable cases at the country level.
- We provide projections of the number of cases and bed demand.
- 40 (Guinea), 550 (Sierra Leone) assessment beds required to isolate all suspected cases.
- 20 (Guinea), 0 (Sierra Leone) treatment beds required to isolate all confirmed cases.
Introduction
Motivation
- WHO provides weekly number of confirmed & probable cases at the subnational level for Guinea and Sierra Leone.
- WHO data comes from the linelist, which is the most reliable data source because it is continously cleaned. In particular, it takes into account reclassification and thus avoid double counting of cases.
- However, the linelist is updated with substantial delay so that the number of cases is well underestimated on the most recent weeks.
- By contrast, the daily SitReps are published with a delay of a few days only.
- We compared both data sources and then used a reliable combination of both to perform our fitting and forecast.
Data sources
- We compare and combine data published by WHO and data compiled from the daily sitreps of the Ministry of Health of Guinea and Sierra Leone.
- Data were extracted automatically where possible and otherwise manually.
- All figures in this report are compiled up to the week ending 26 July 2015.
- We would like to hear about your needs in order to create more specific figures and include them in future reports. Please get in touch with us at ebola_sitrep@lshtm.ac.uk.
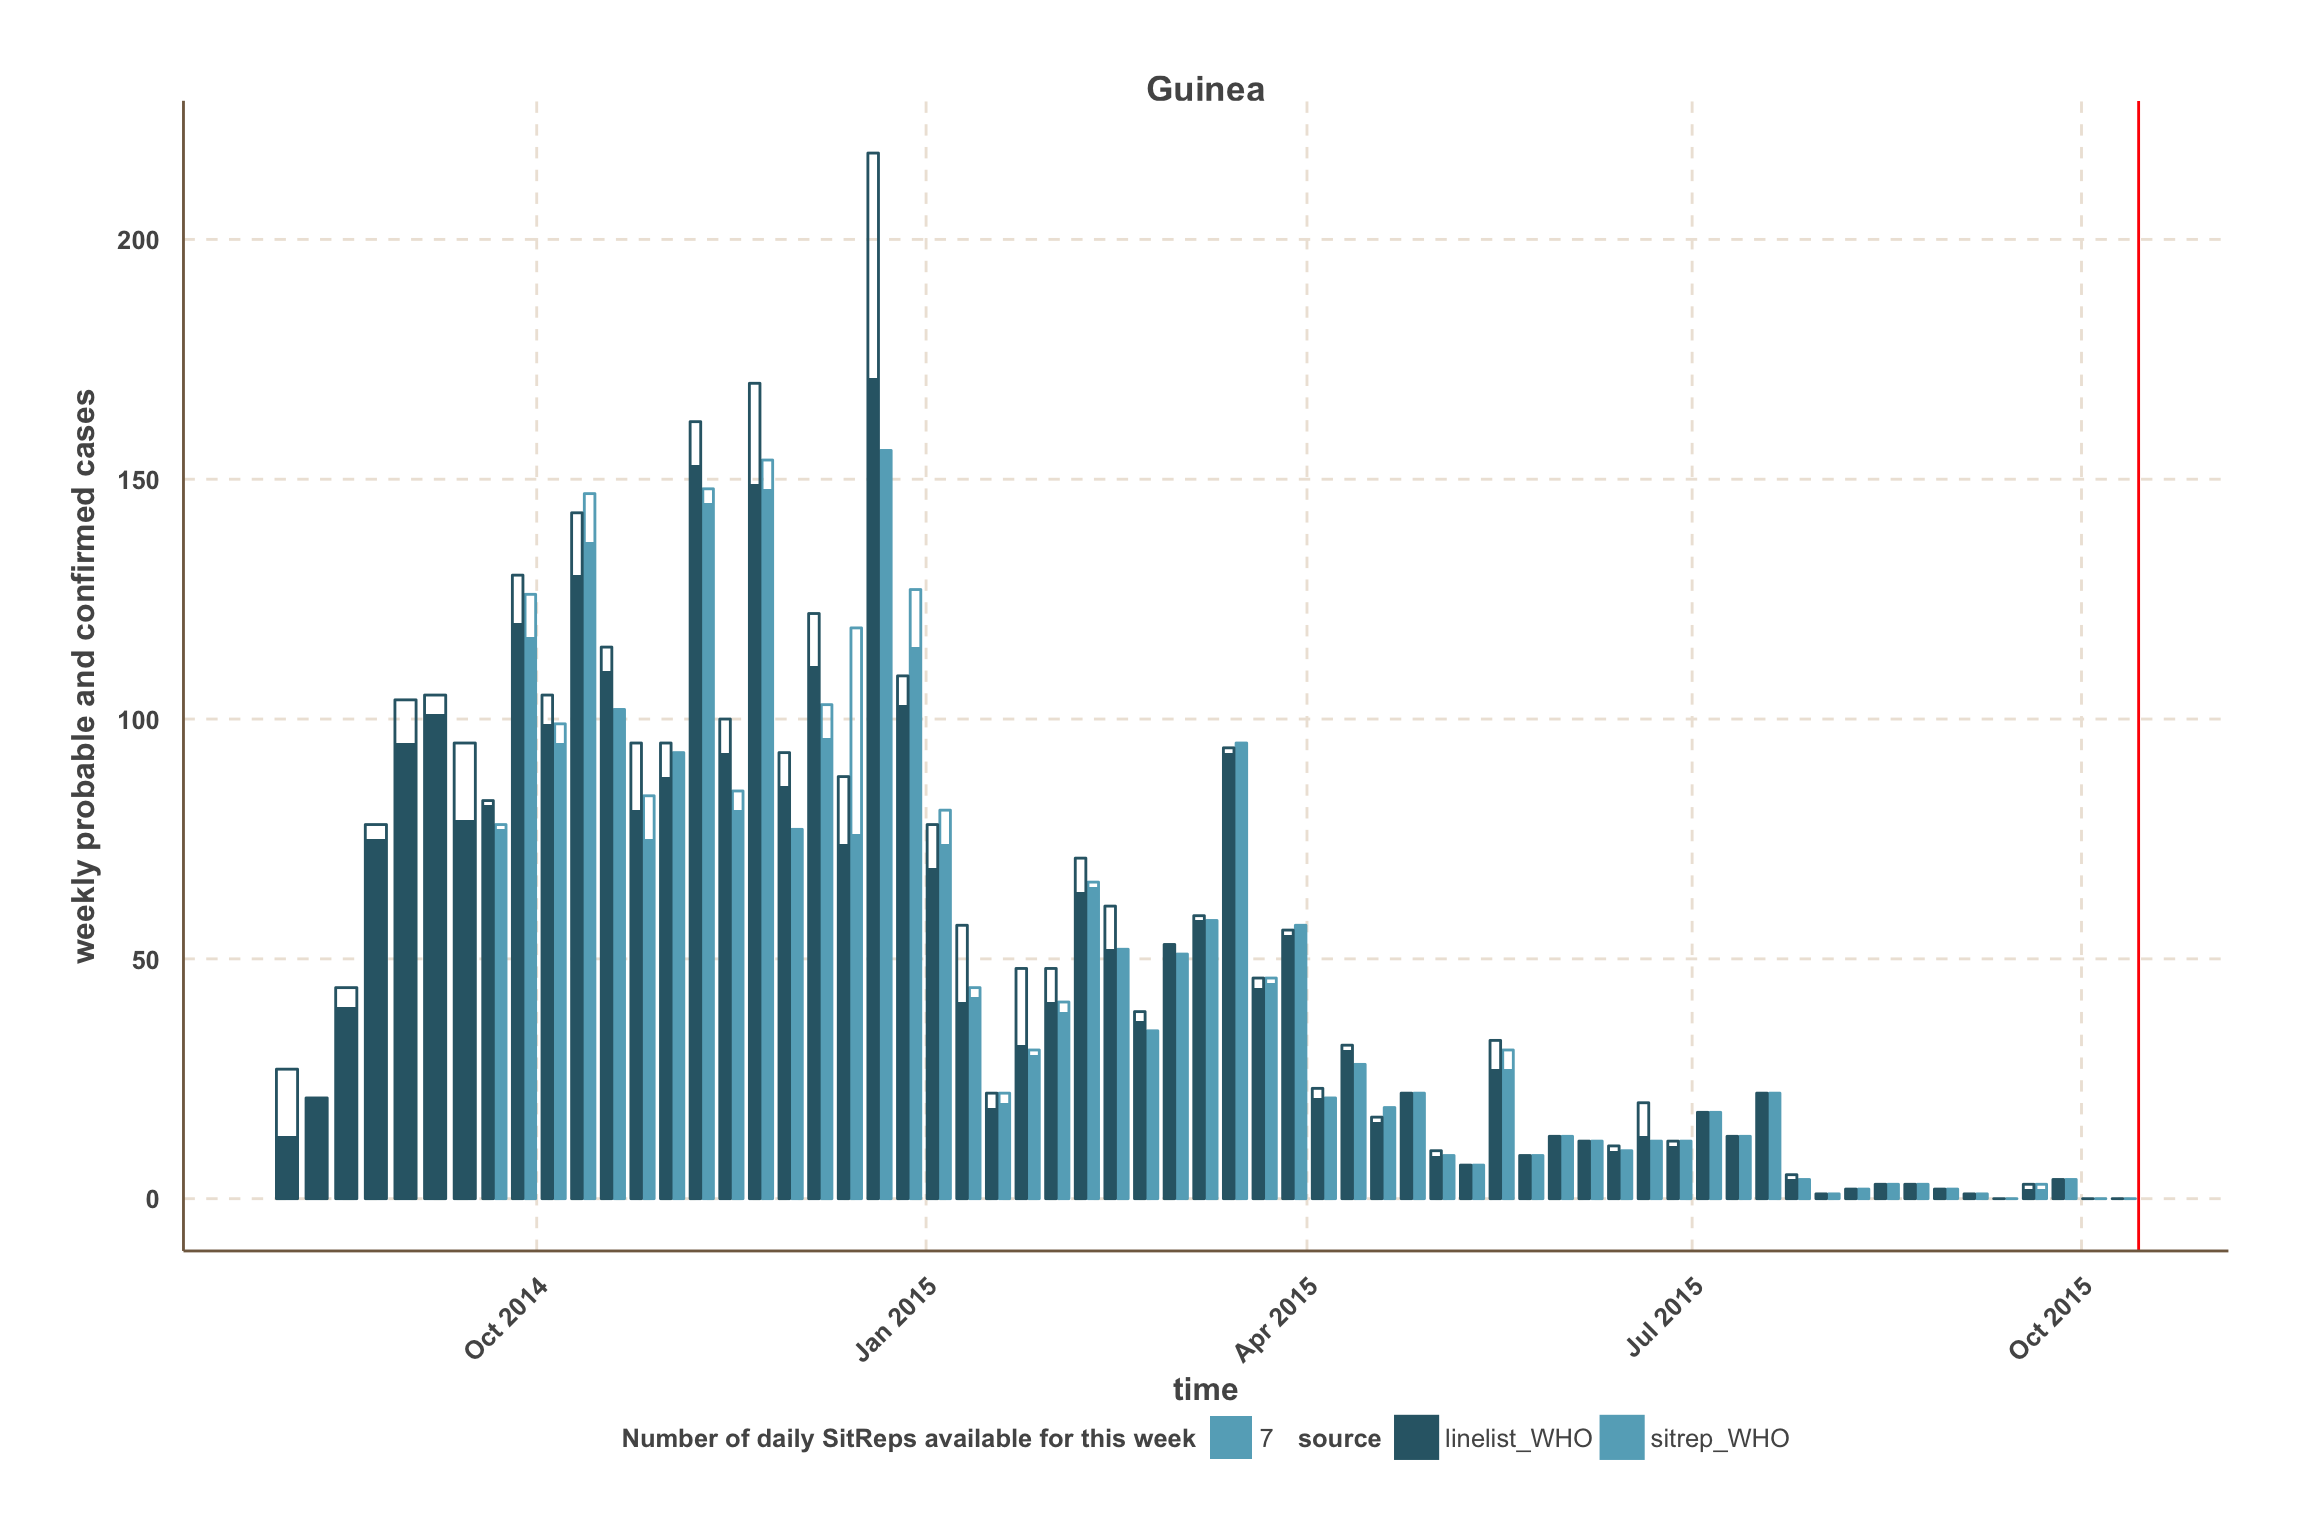
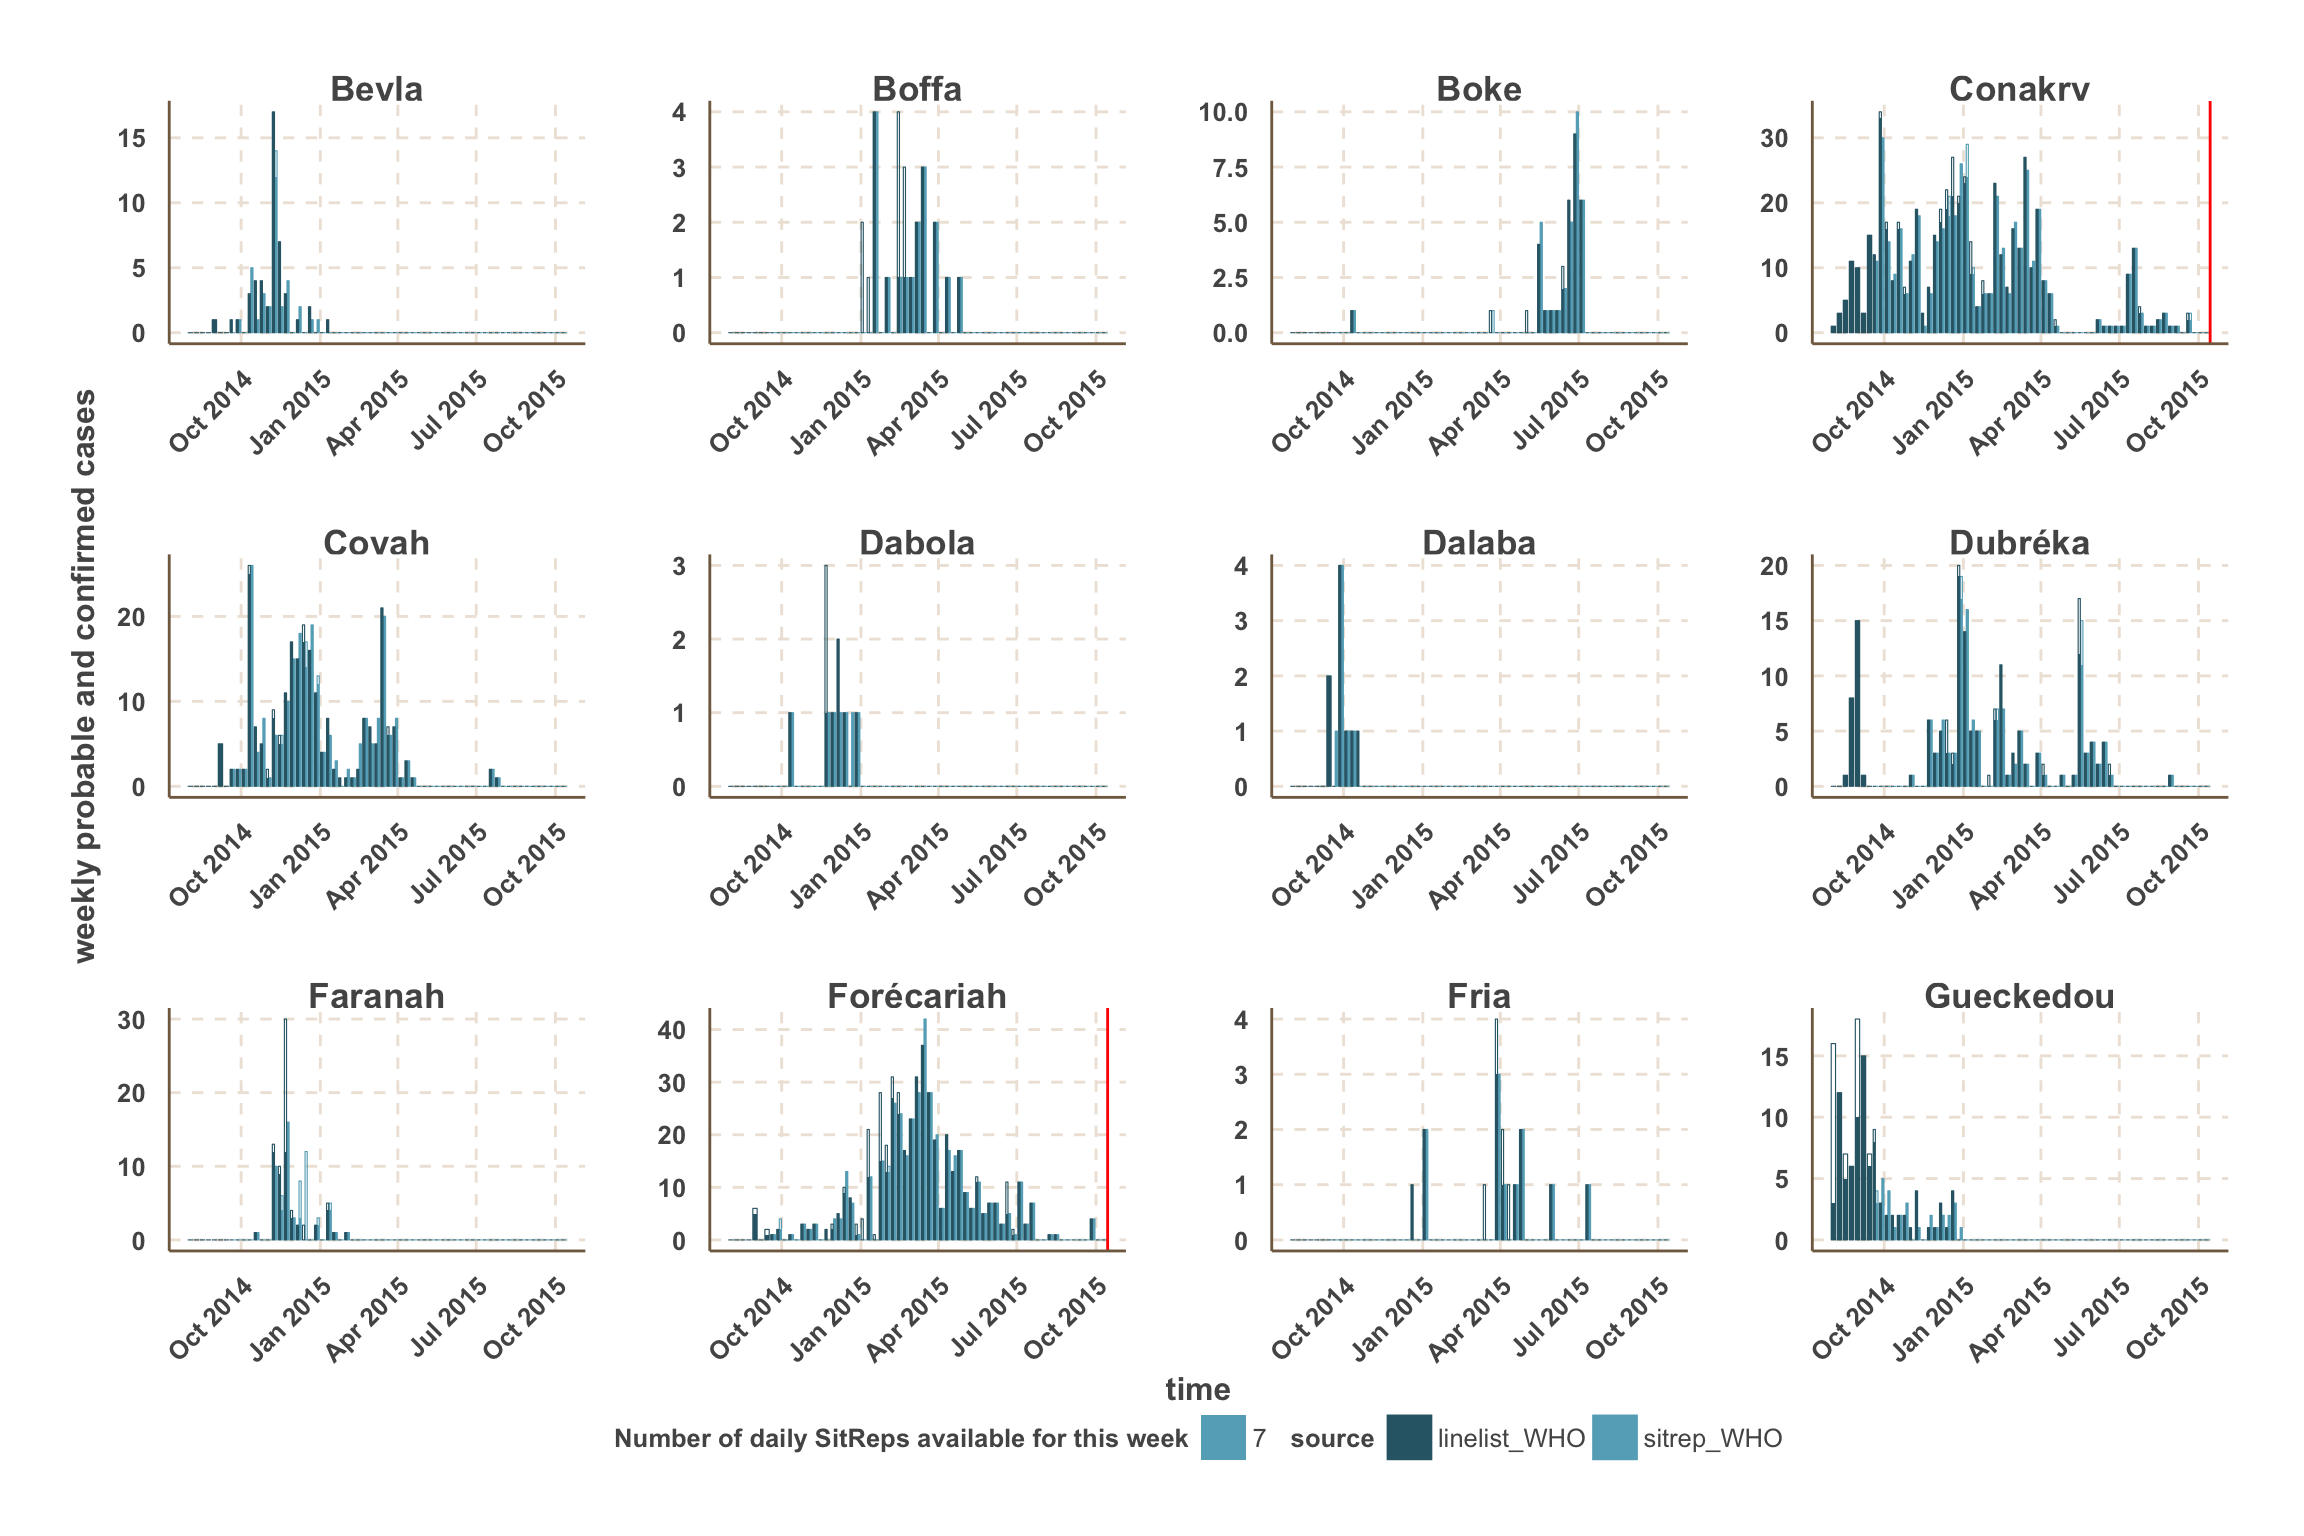
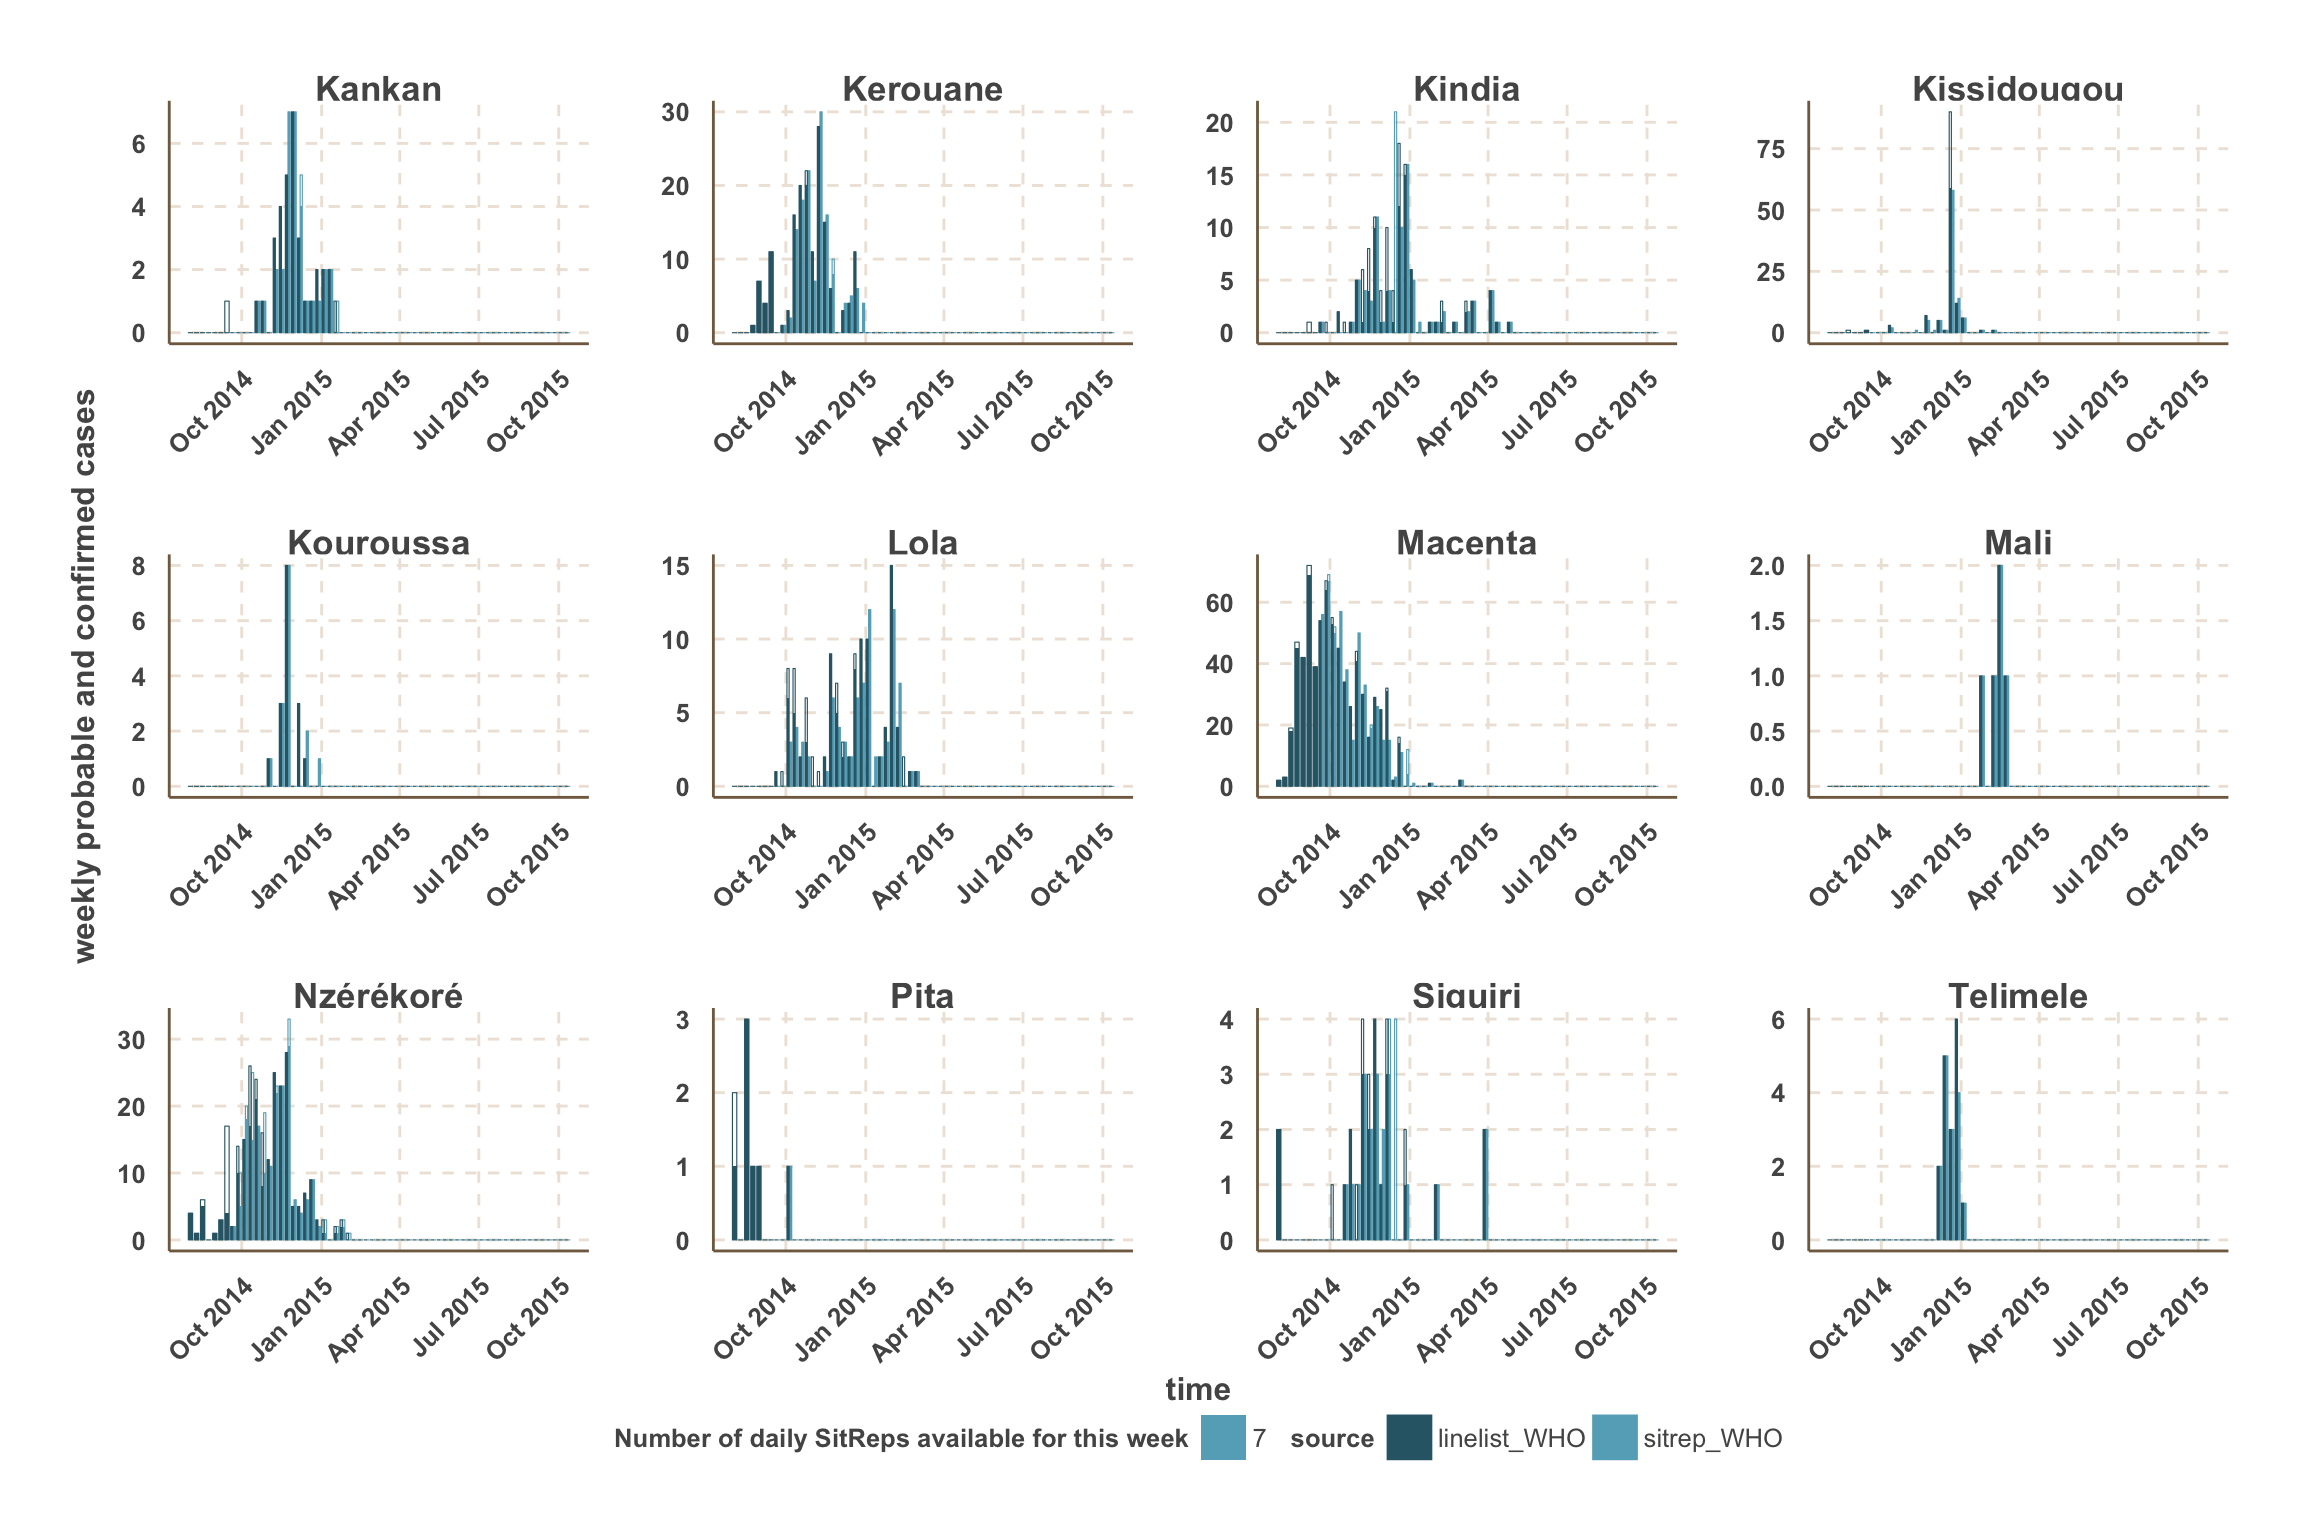
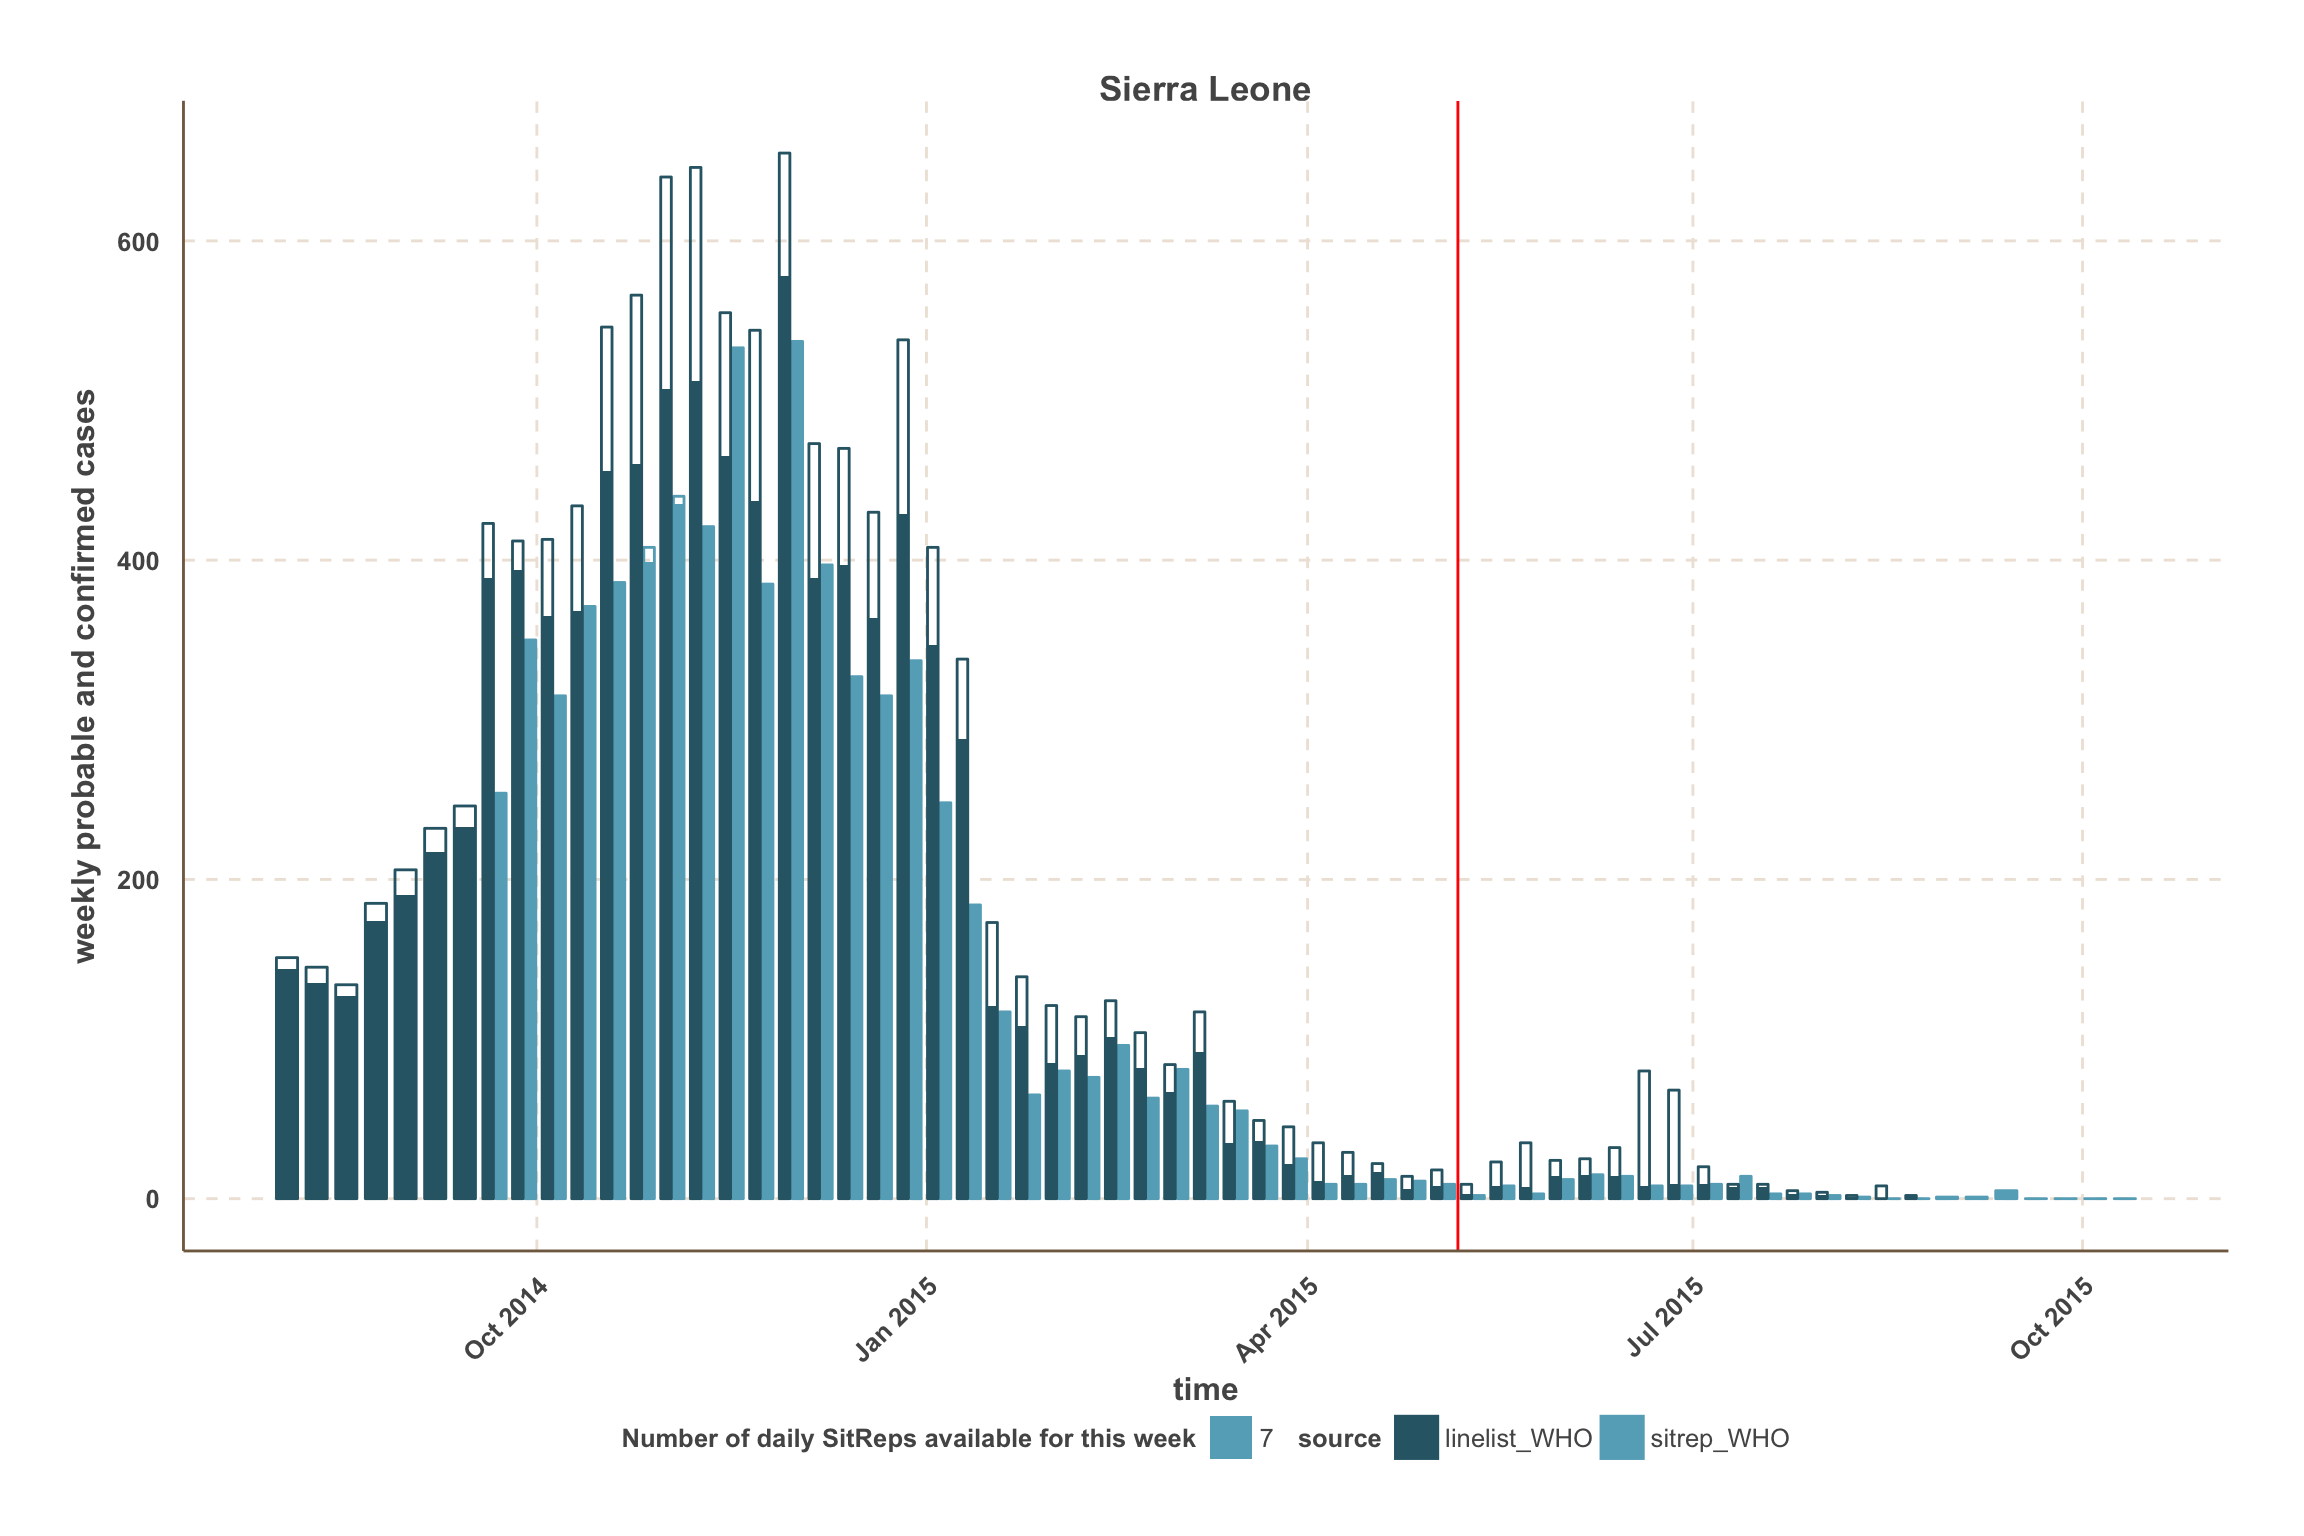
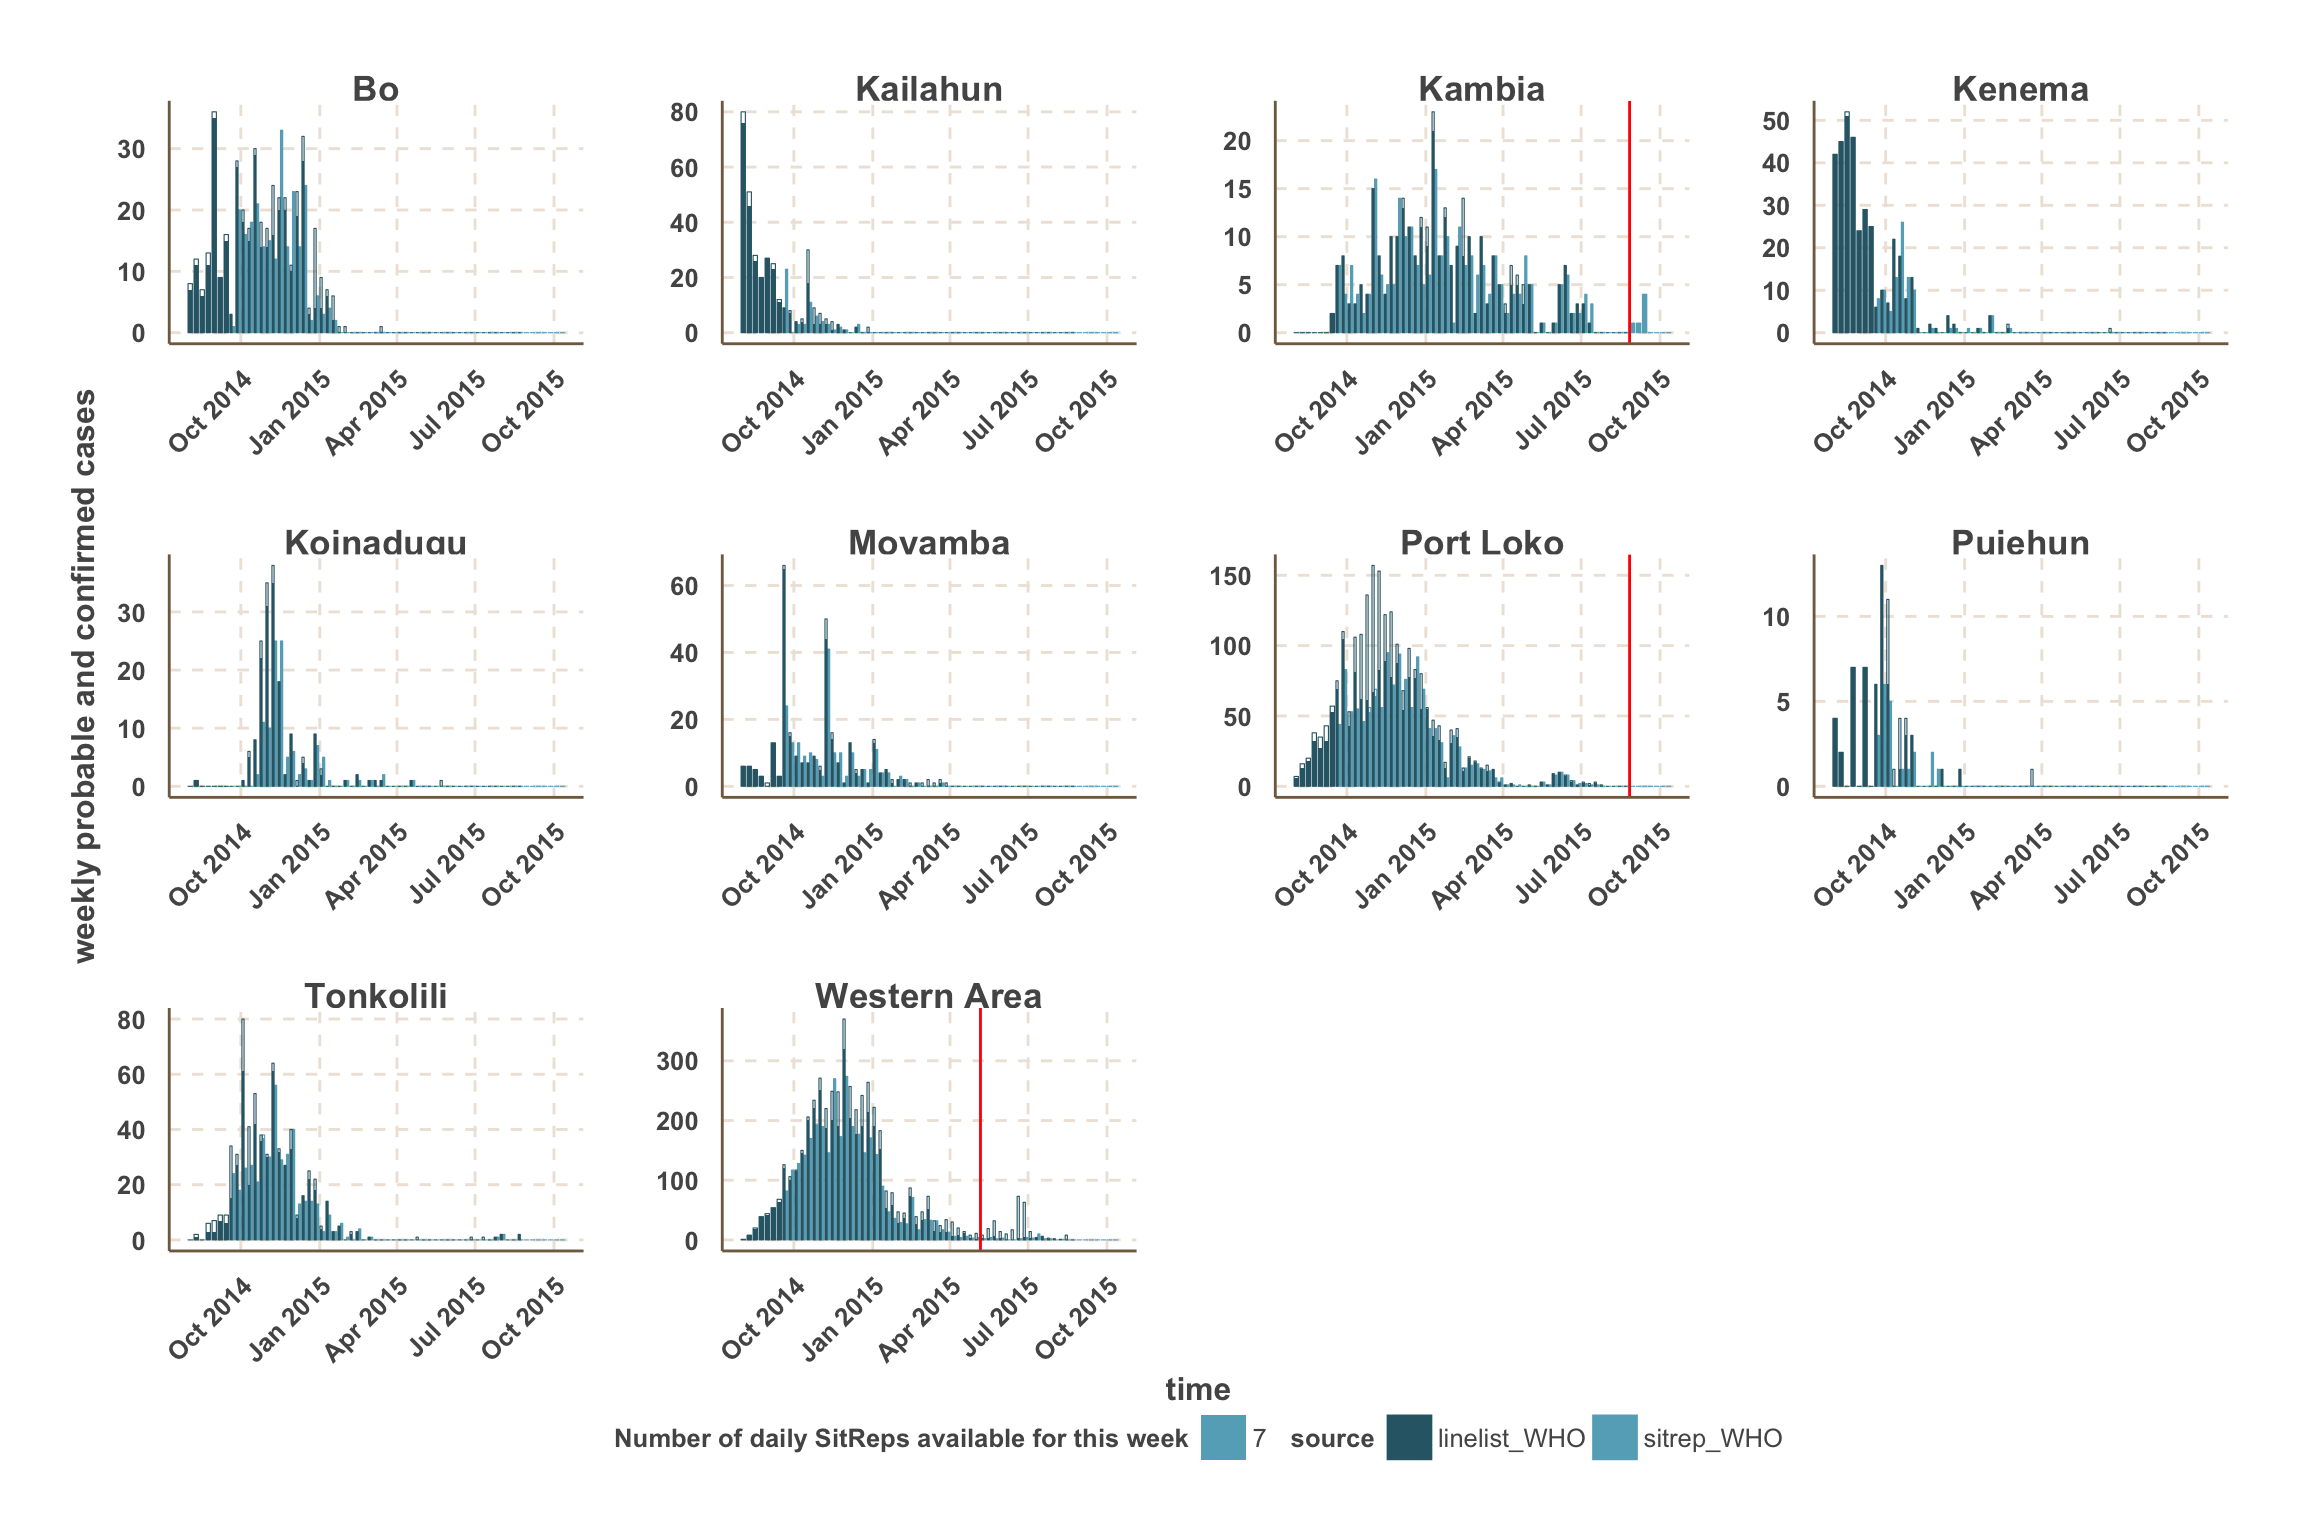
Weekly new confirmed and probable cases
Summary
- Overall, WHO data give the best estimate of the number of confirmed & probable cases up to 4 weeks before the latest week reported.
- We note several differences between countries:
- Guinea data from WHO seem the most up-to-date, with good agreement with the latest SitReps
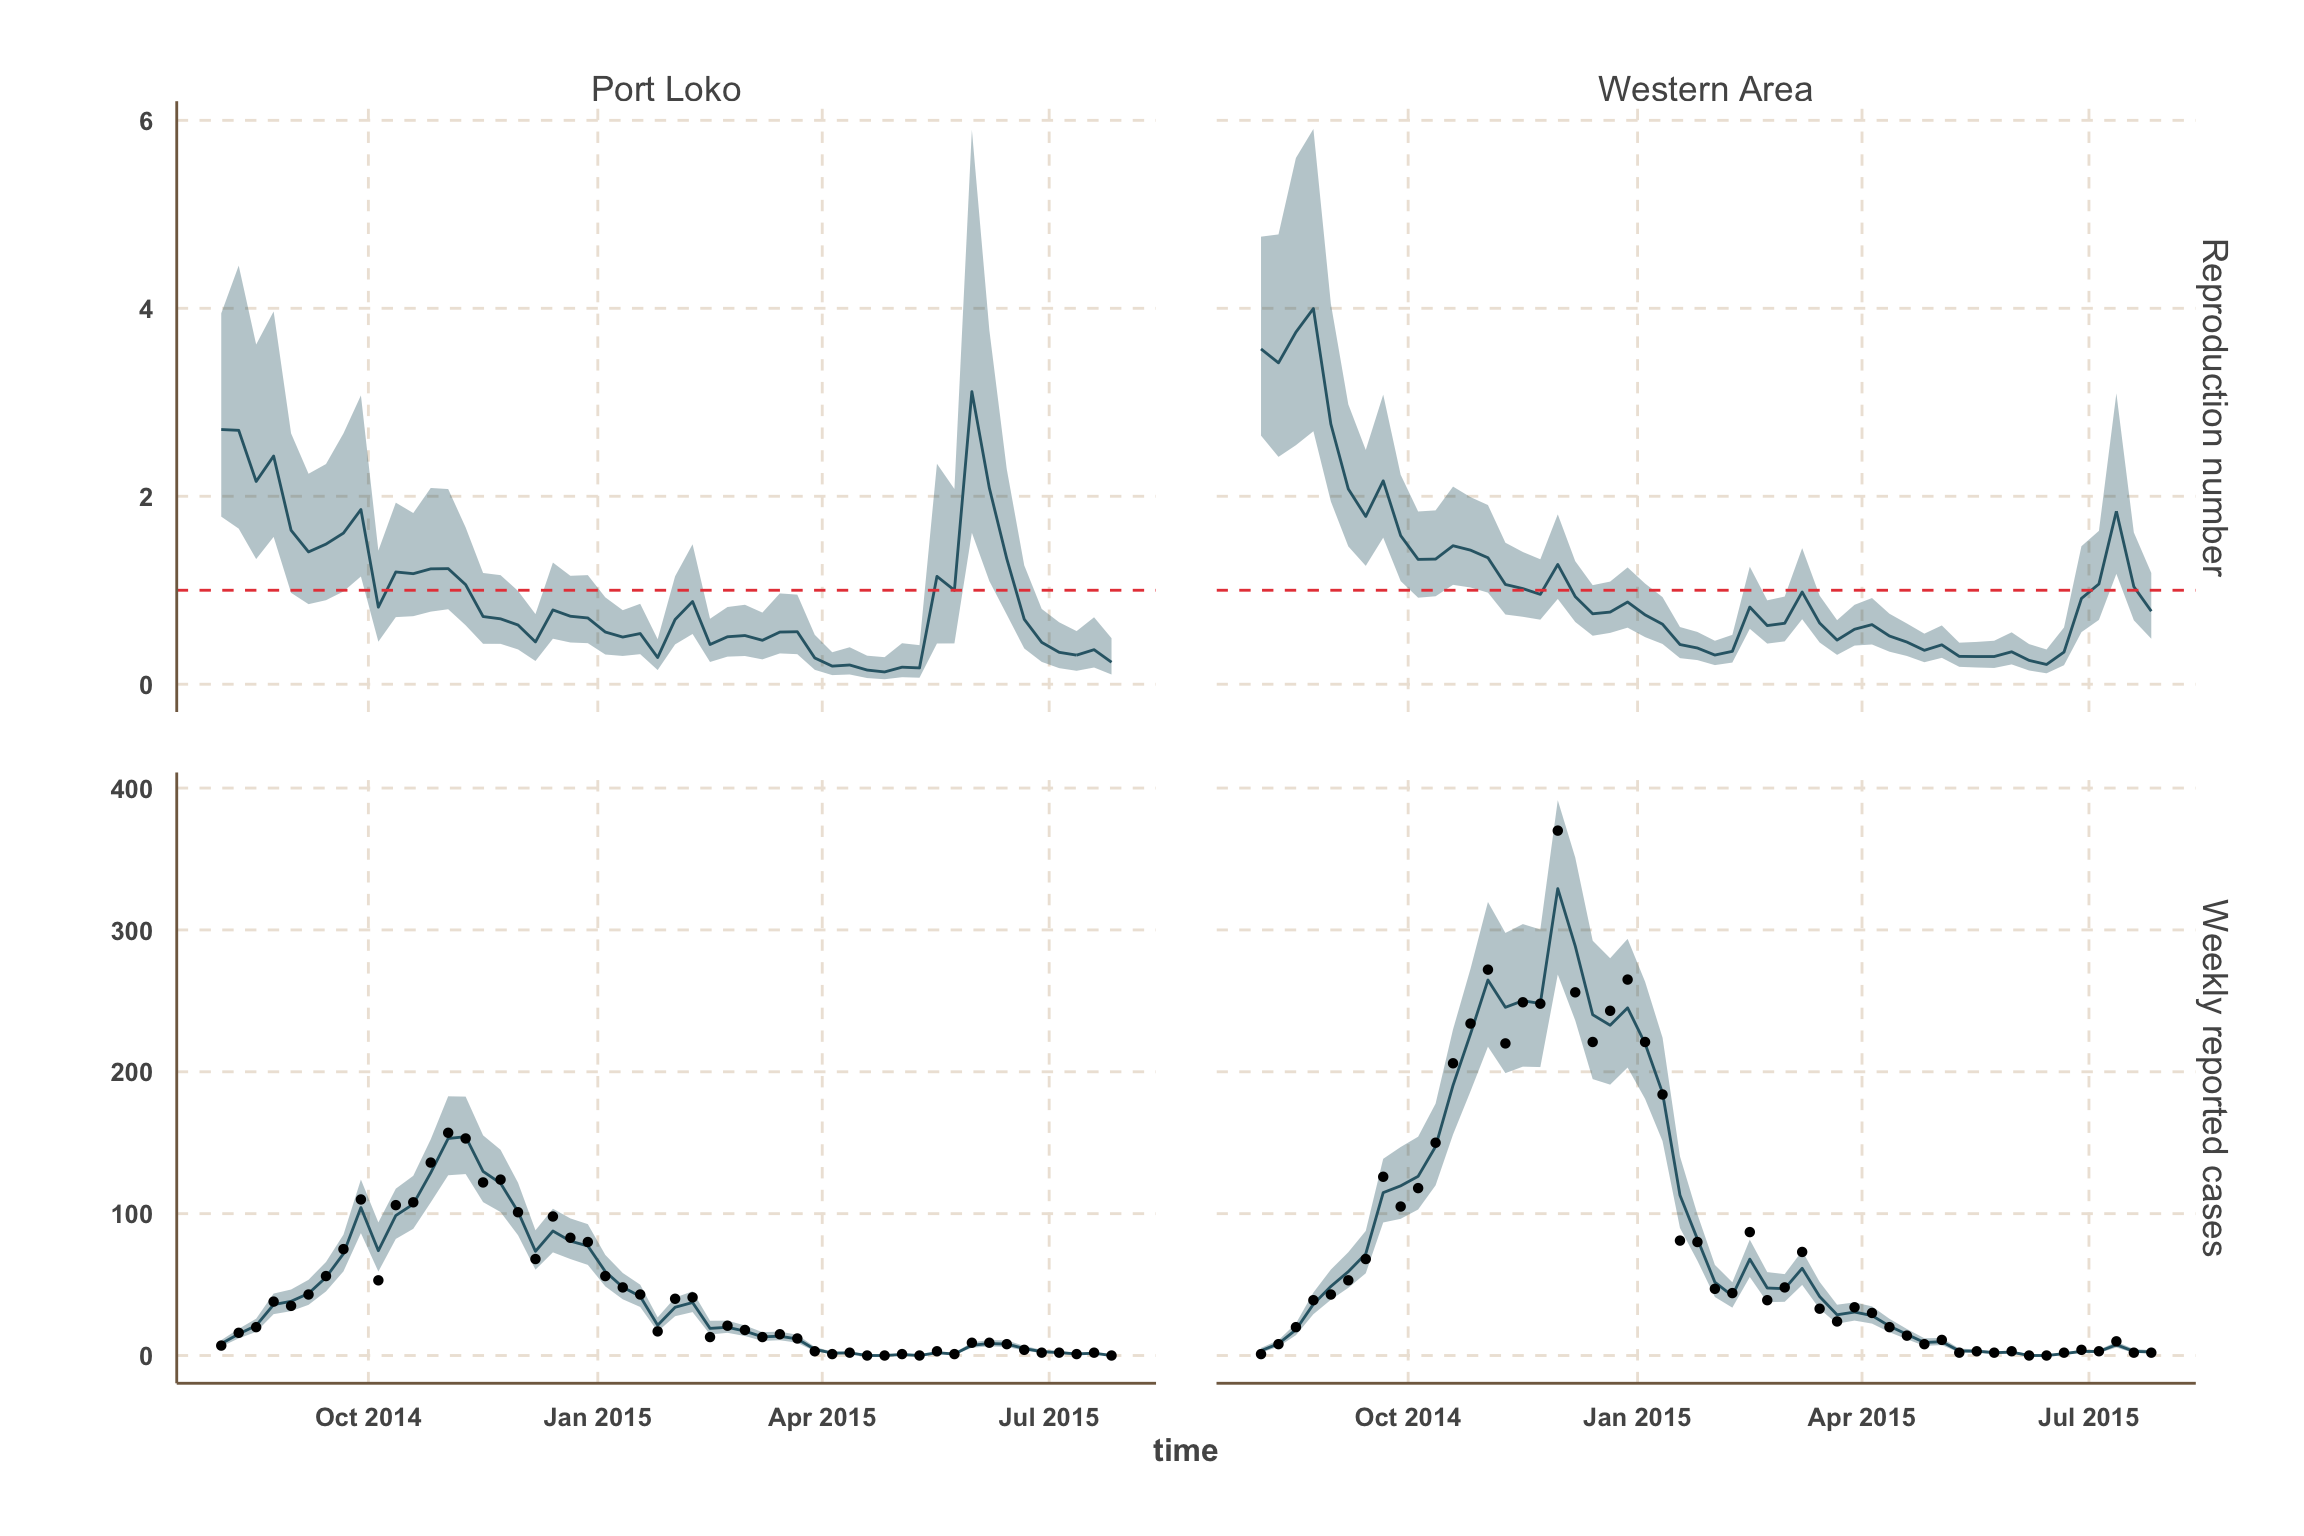
- Sierra Leone data from WHO show variable reporting delays at the county level. However, the number of cases in Port Loko was underestimated in the SitReps until mid-November.
Notes
- Weeks with missing daily SitReps appear slightly transparent, according to the number of missing SitReps.
- For each data source, the proportion of the bar that is filled represents confirmed cases.
- For fitting and forecast we focus on the counties with the most active transmission over the past 3 weeks.
- For those counties, a vertical red line indicates the date after which we use SitRep data for the number of confirmed & probable cases.
Guinea
Sierra Leone
Modelling & Forecast
Note
- Forecasts are useful to plan interventions and clinical trials.
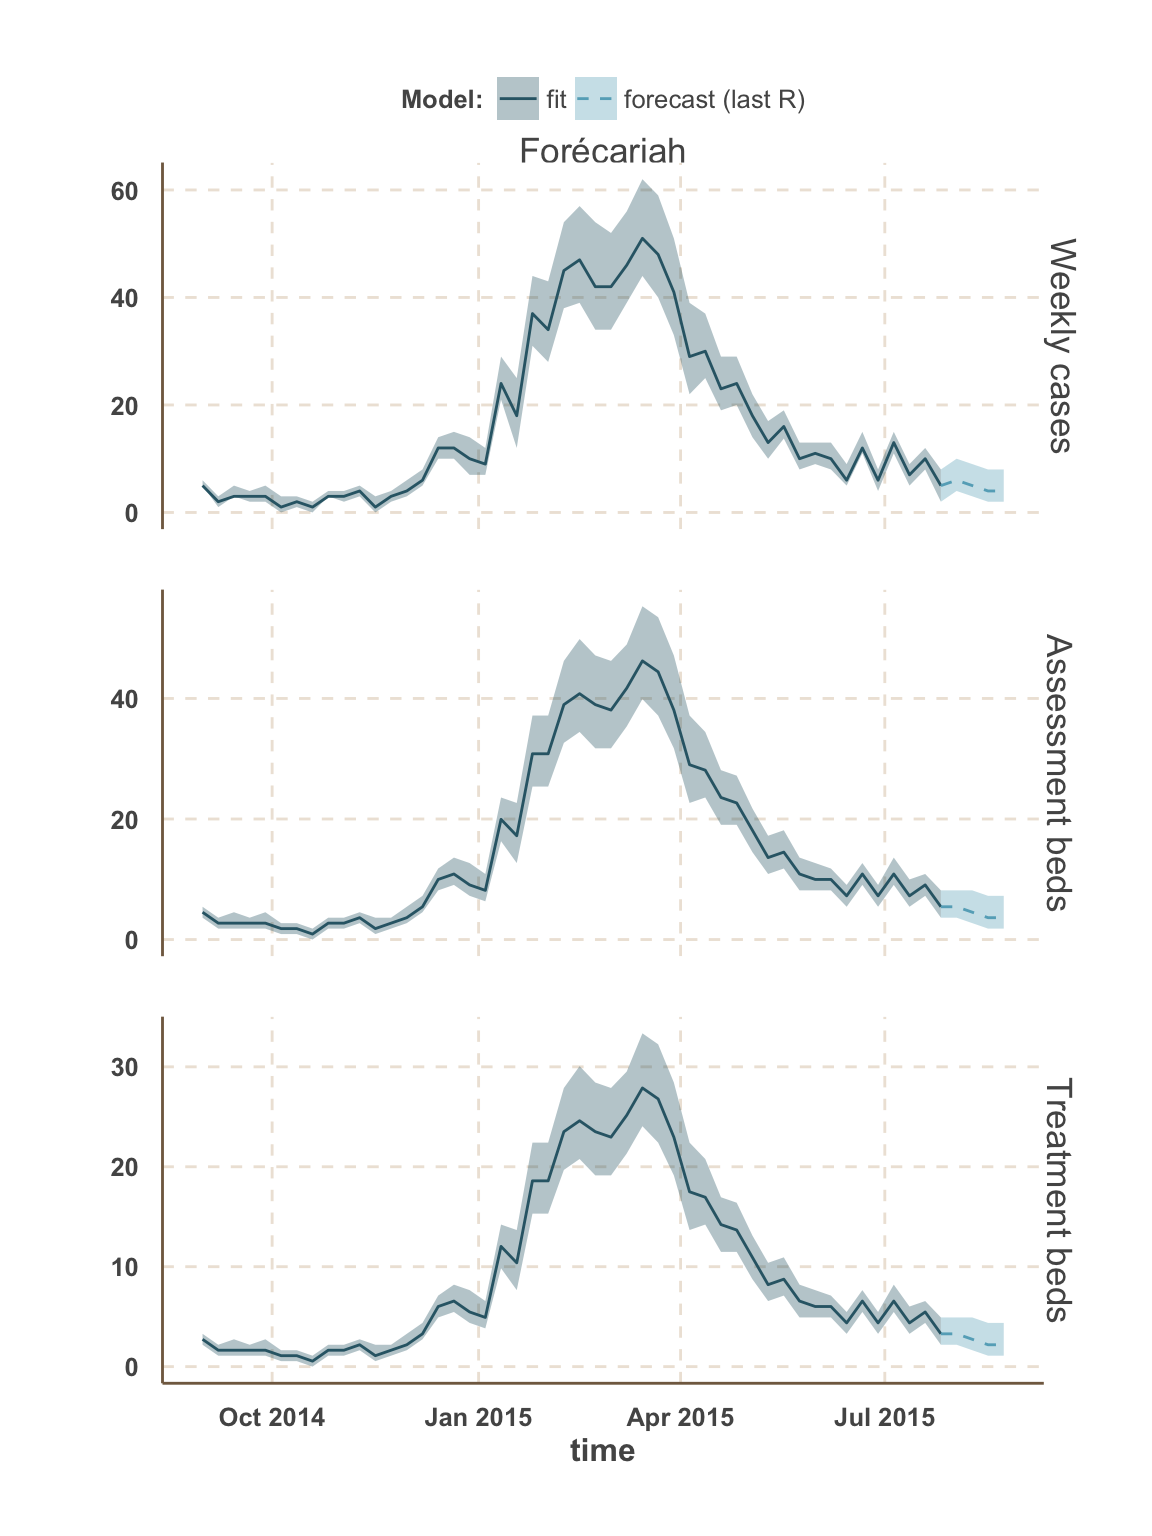
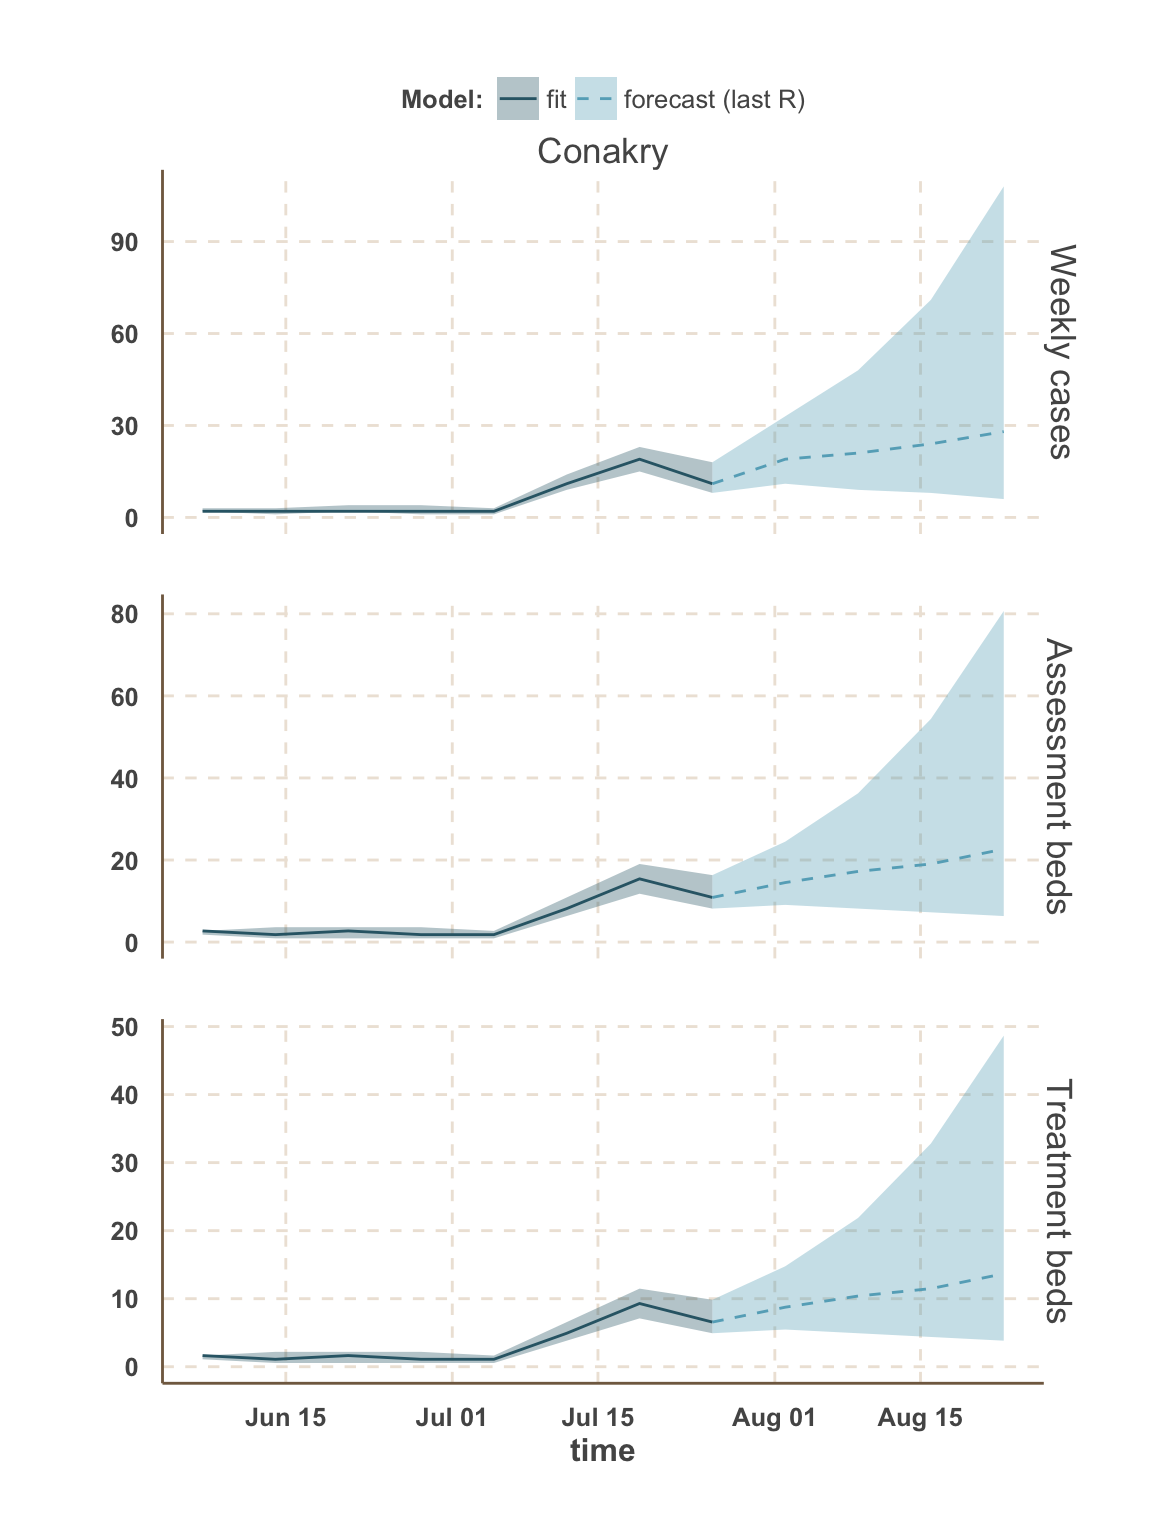
- In this analysis, we focus on the 5 districts with the most active transmission over the past 3 weeks:
- Guinea: Conakry, Forécariah.
- Sierra Leone: Kambia, Port Loko, Western Area.
- We report median estimates as well as interquartile range credible intervals.
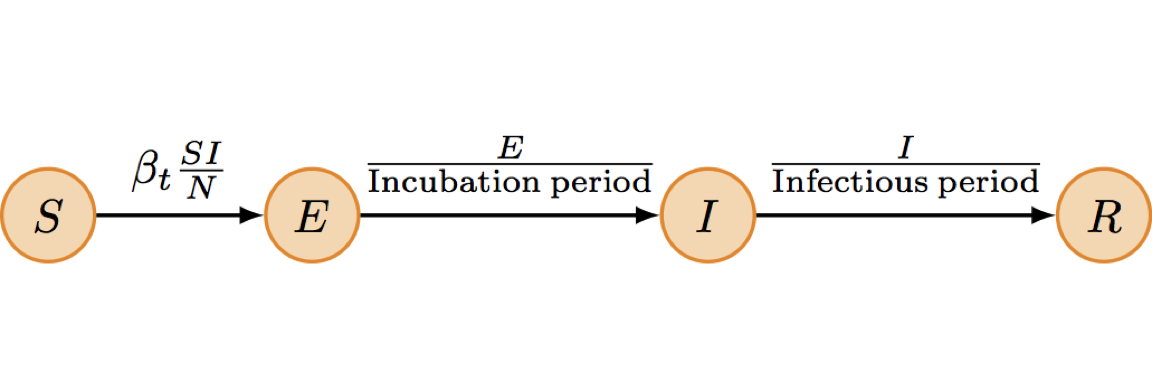
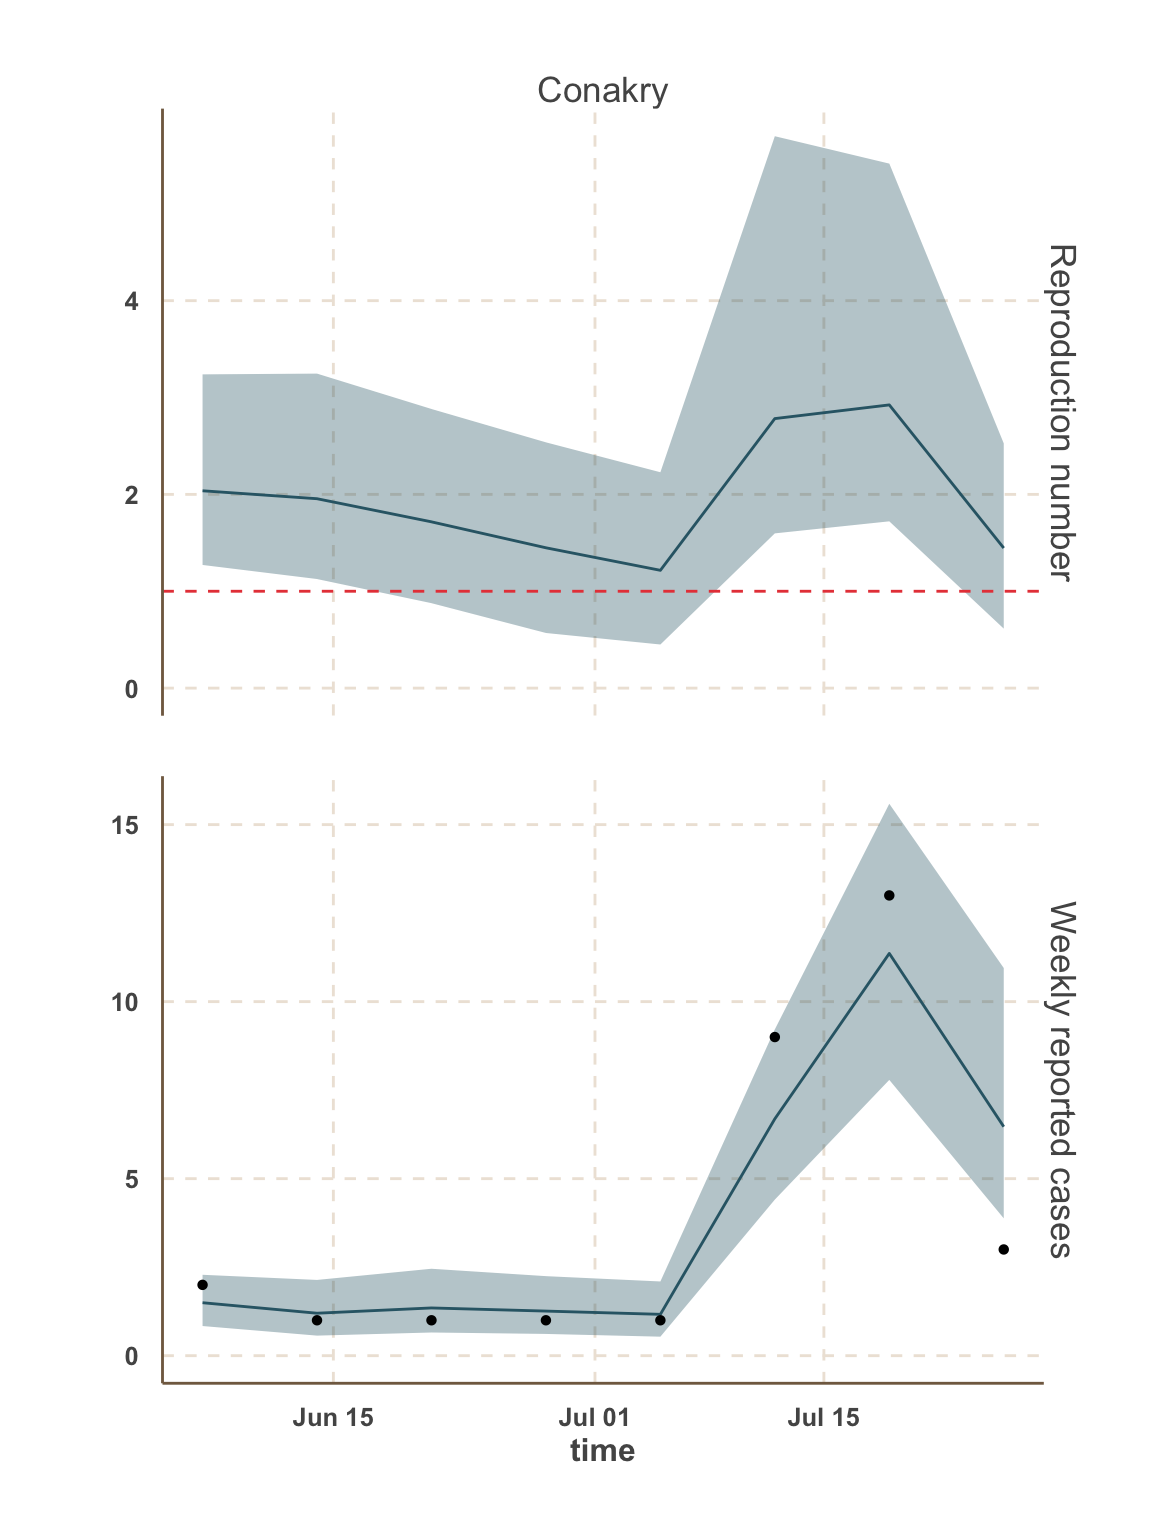
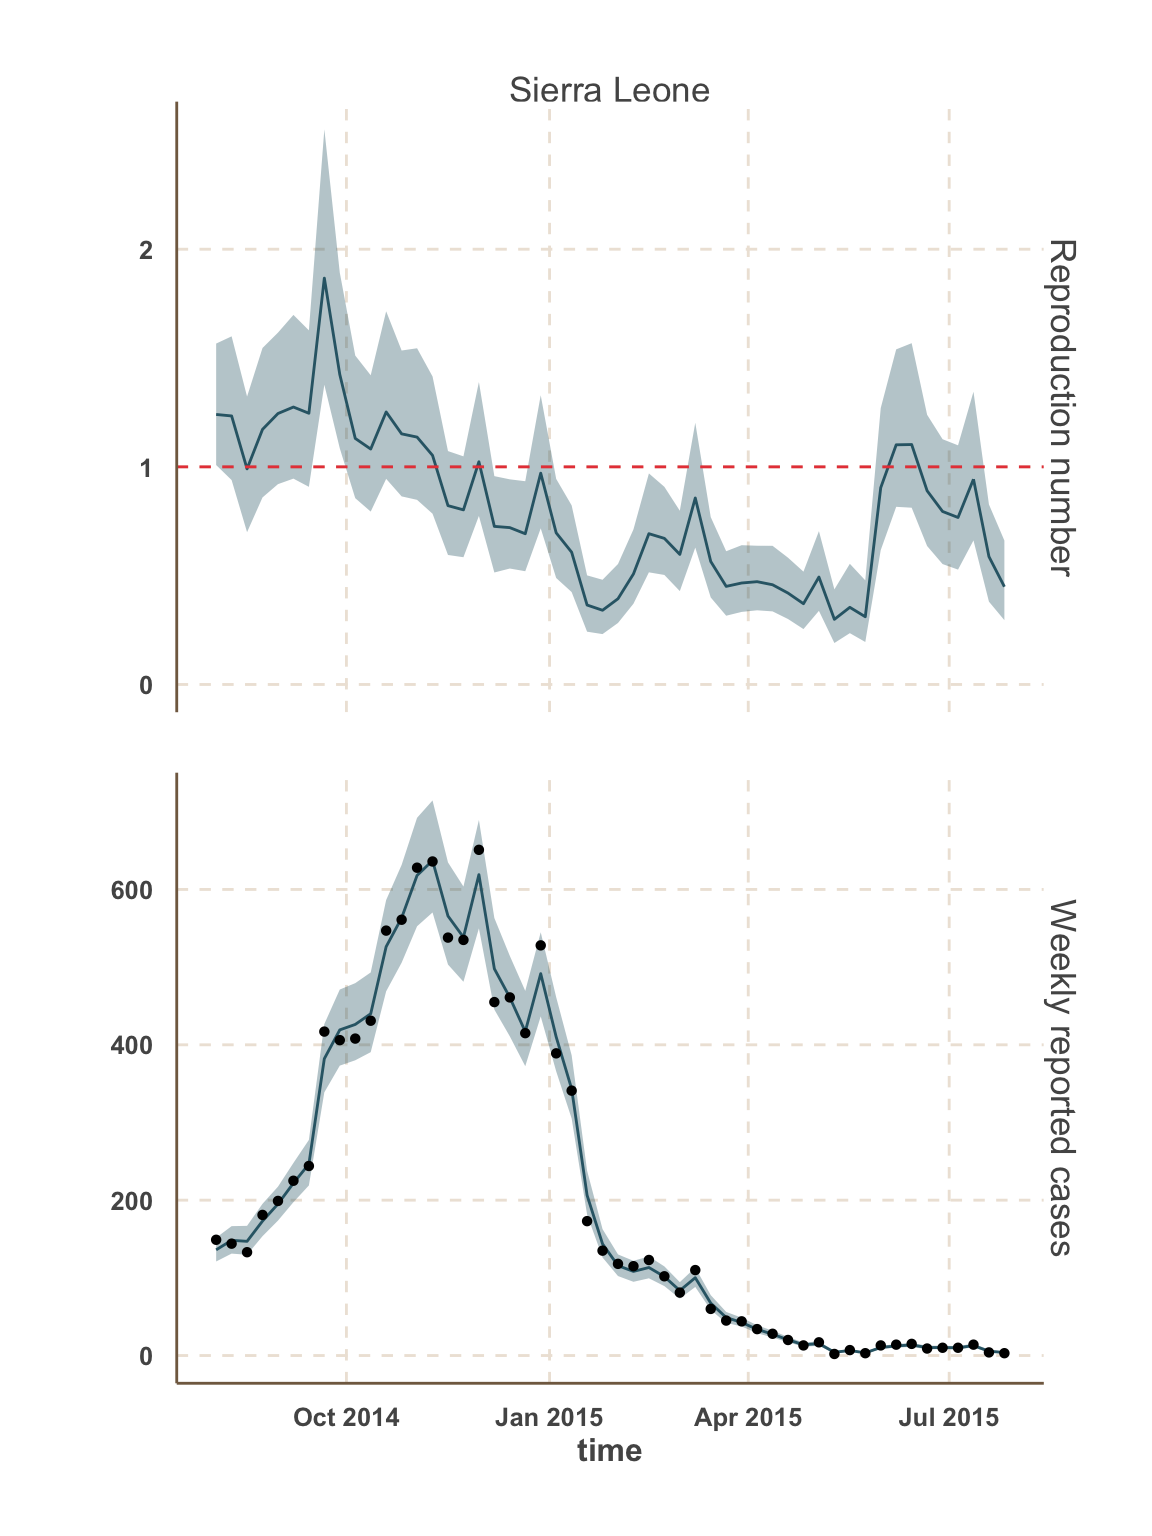
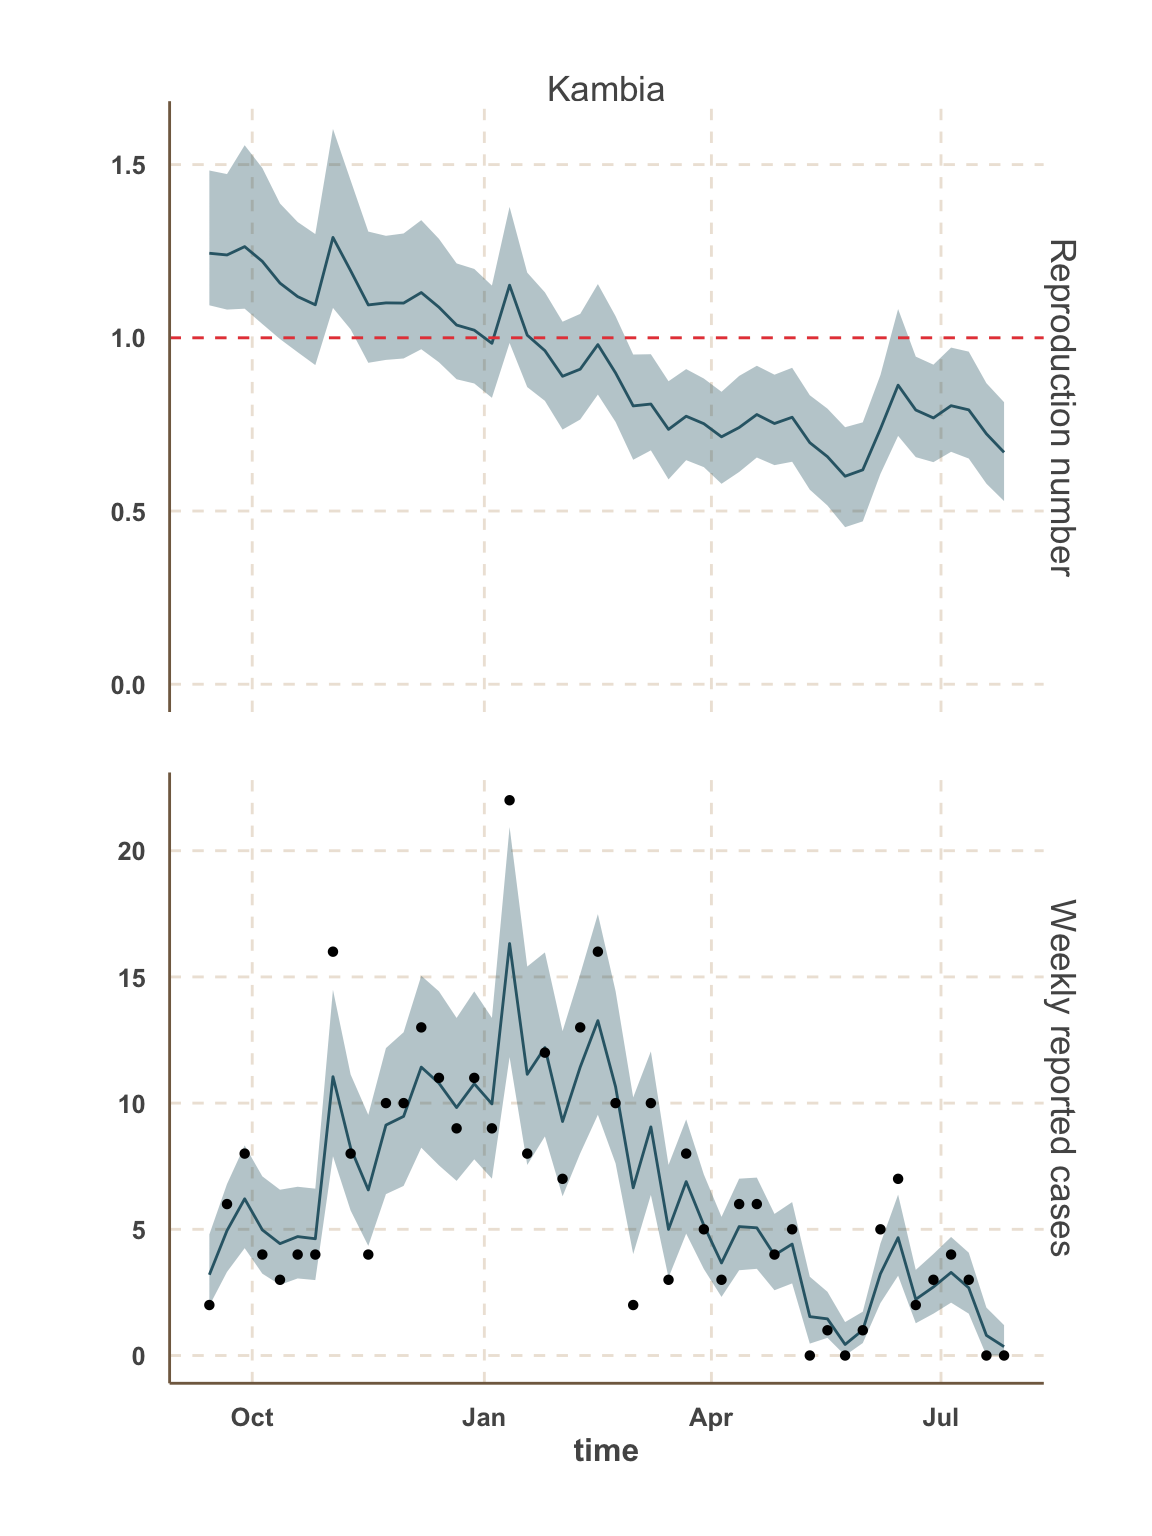
Transmission model
- We set a stochastic transmission model including susceptible, exposed, infectious and removed individuals (SEIR).
- The model was parametrized using country-specific empirical estimates (1) for the incubation (around 9 days) and infectious periods (around 11 days).
- Changes in the reproduction number (\(R_t\)) over time was modelled using a time-varying contact-rate parameter (\(\beta_t\)) (2).
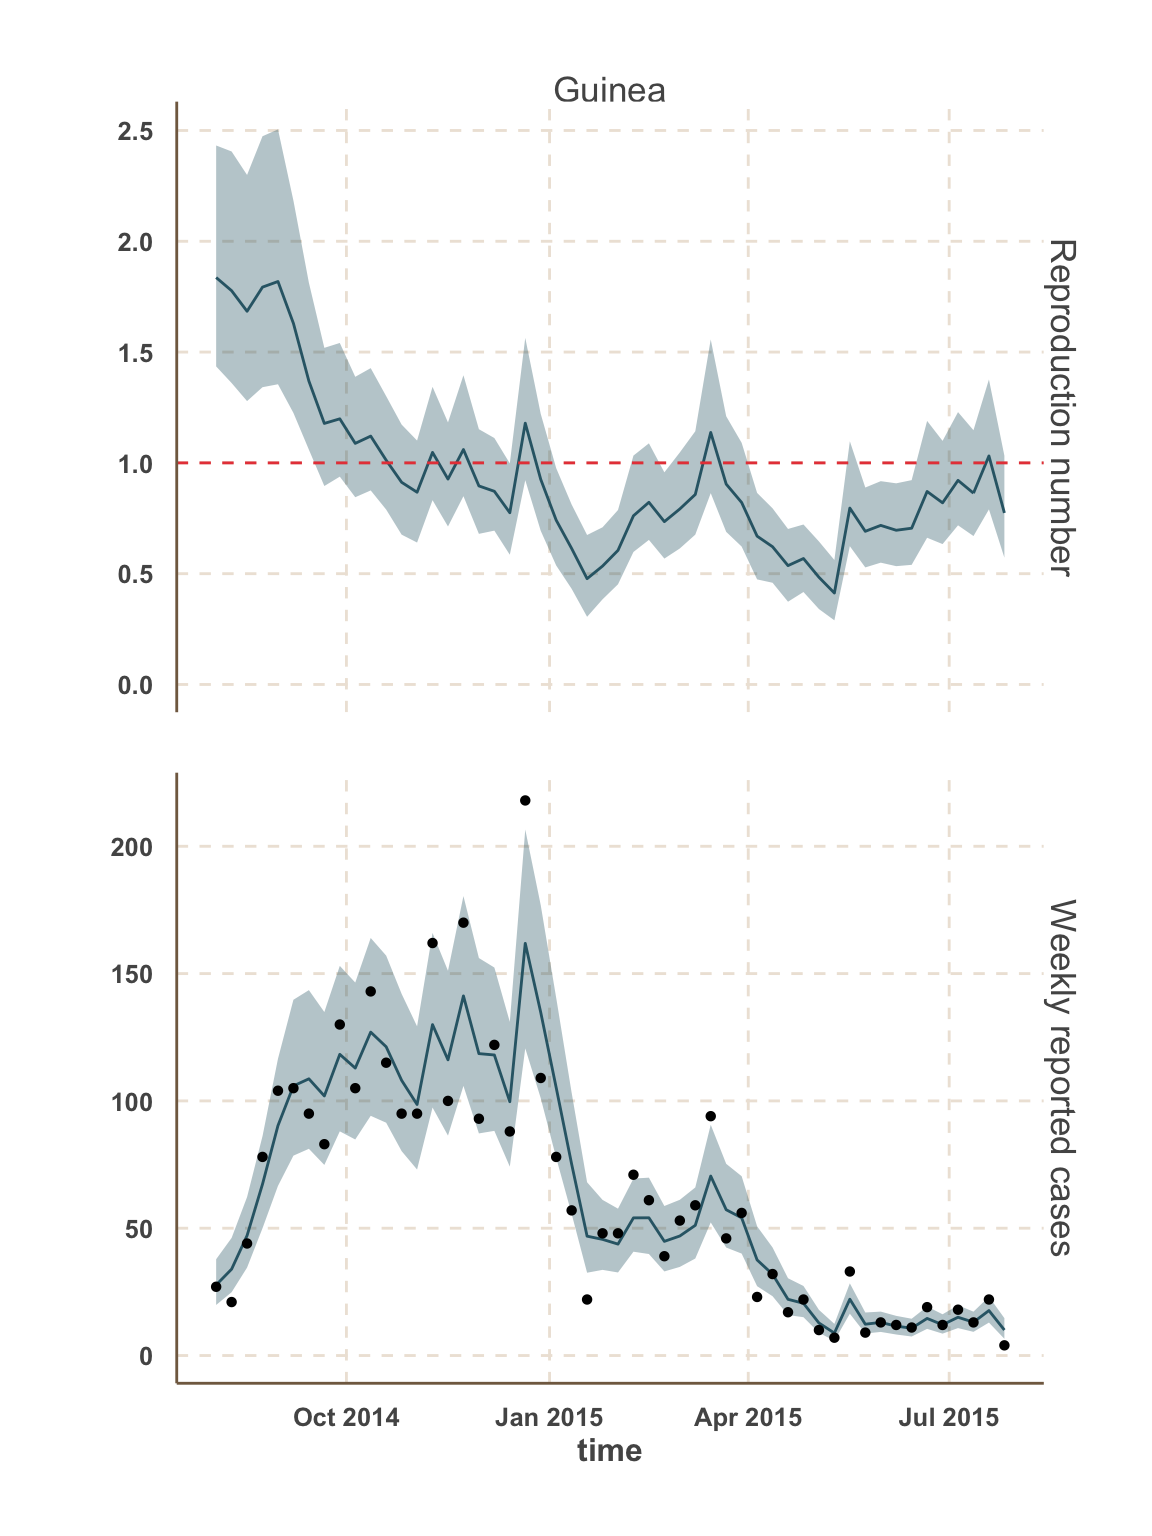
Observation model
- The model was fitted to the time-series of weekly cases (probable and suspected) using a Bayesian approach (3).
- We assumed that only 60% of the cases were reported in the data.
- We used country-specific empirical estimates (1) for the delay between onset of symptoms and notification/hospitalization of reported cases (around 5 days).
- We accounted for missing SitReps in some of the weeks as well as potential over-dispersion in the data.
Model fit: reported cases & \(R_t\)
Guinea
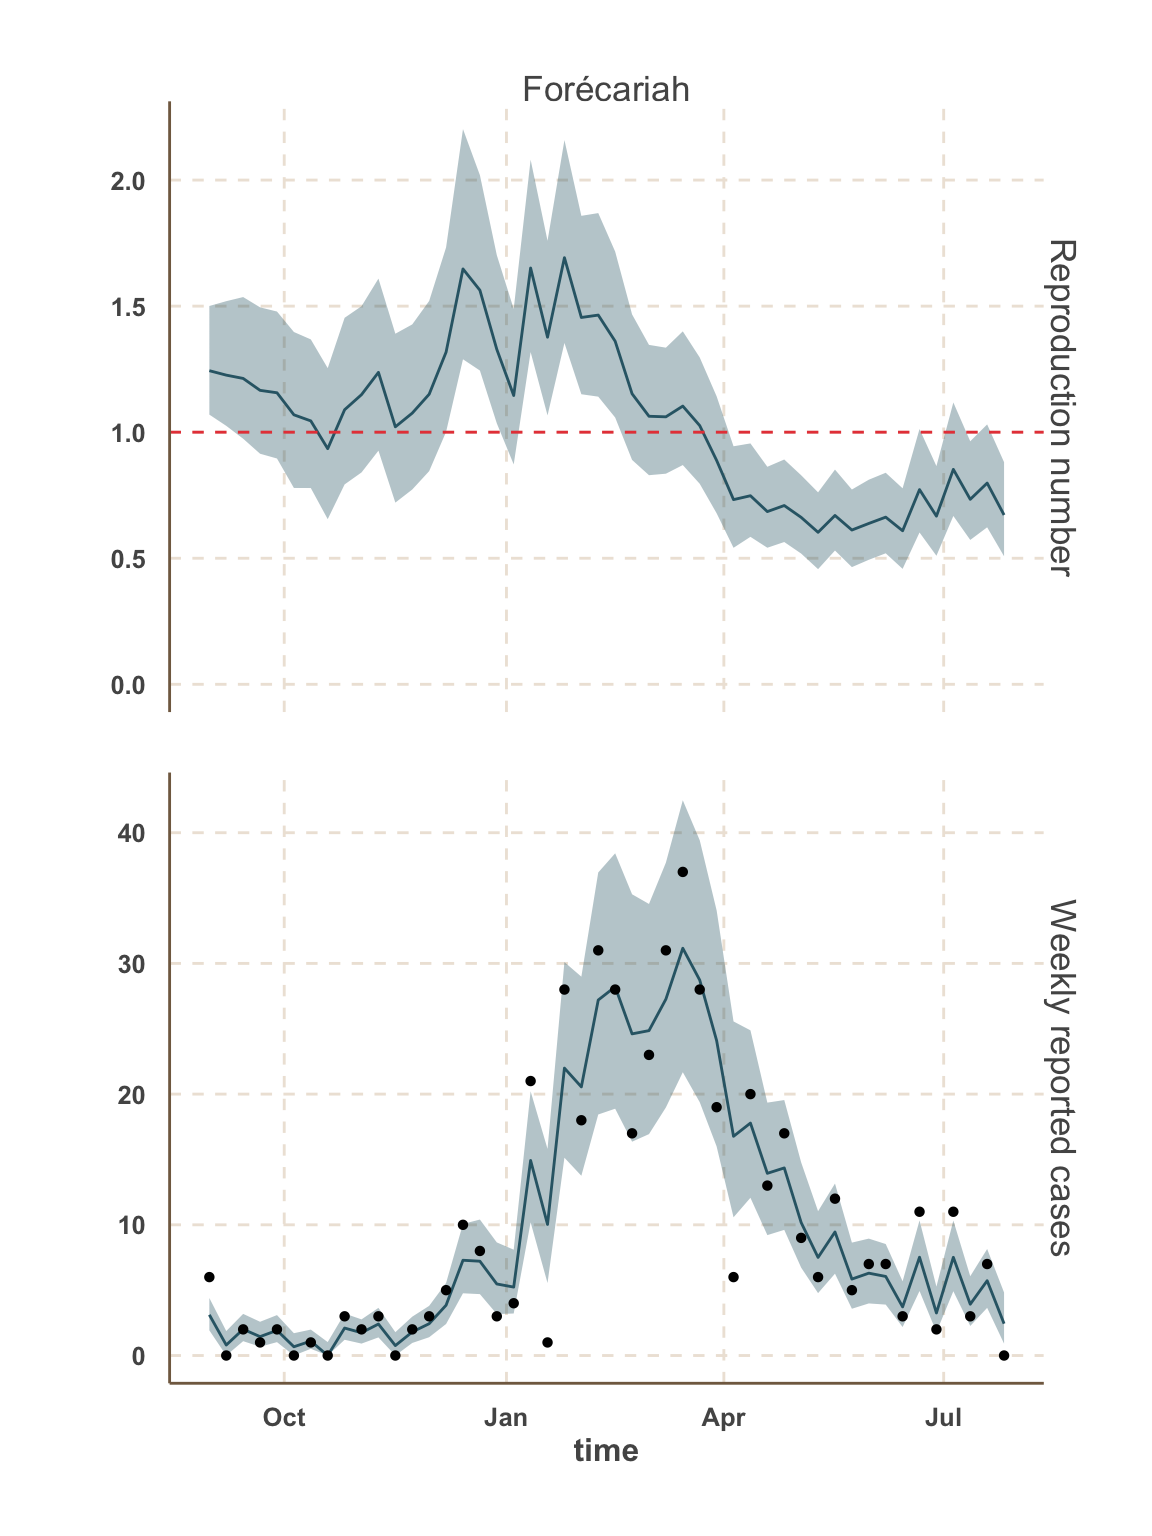
Sierra Leone
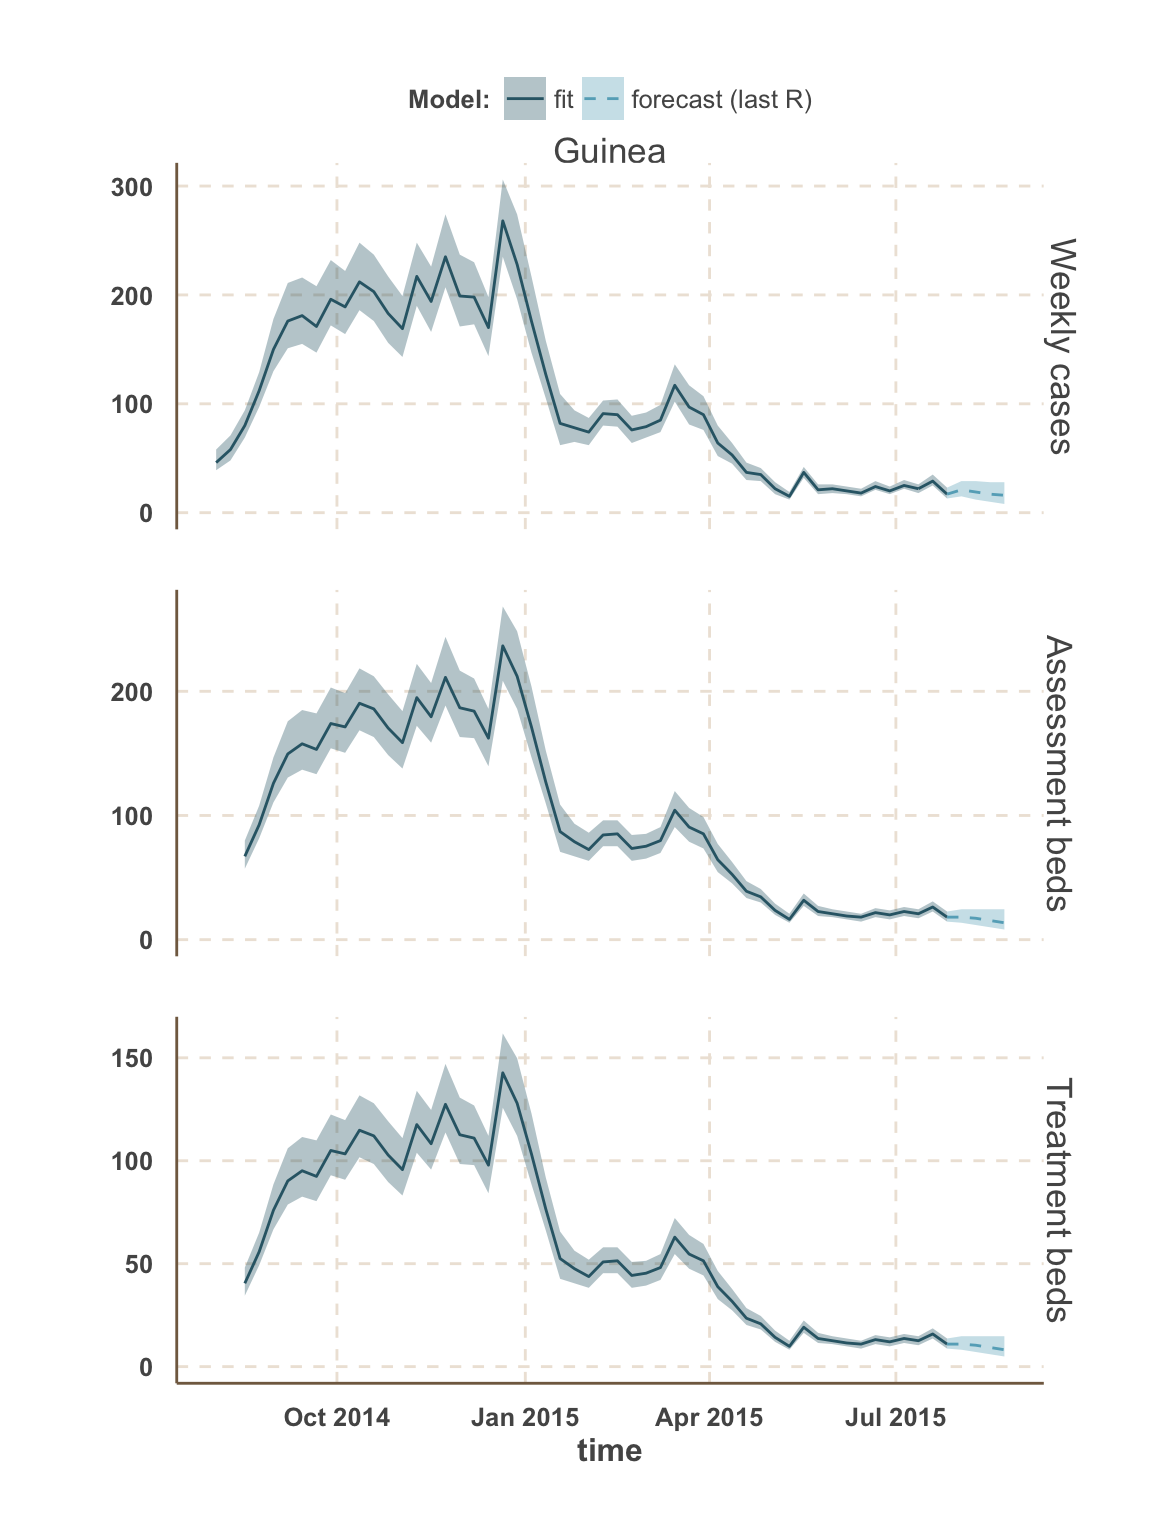
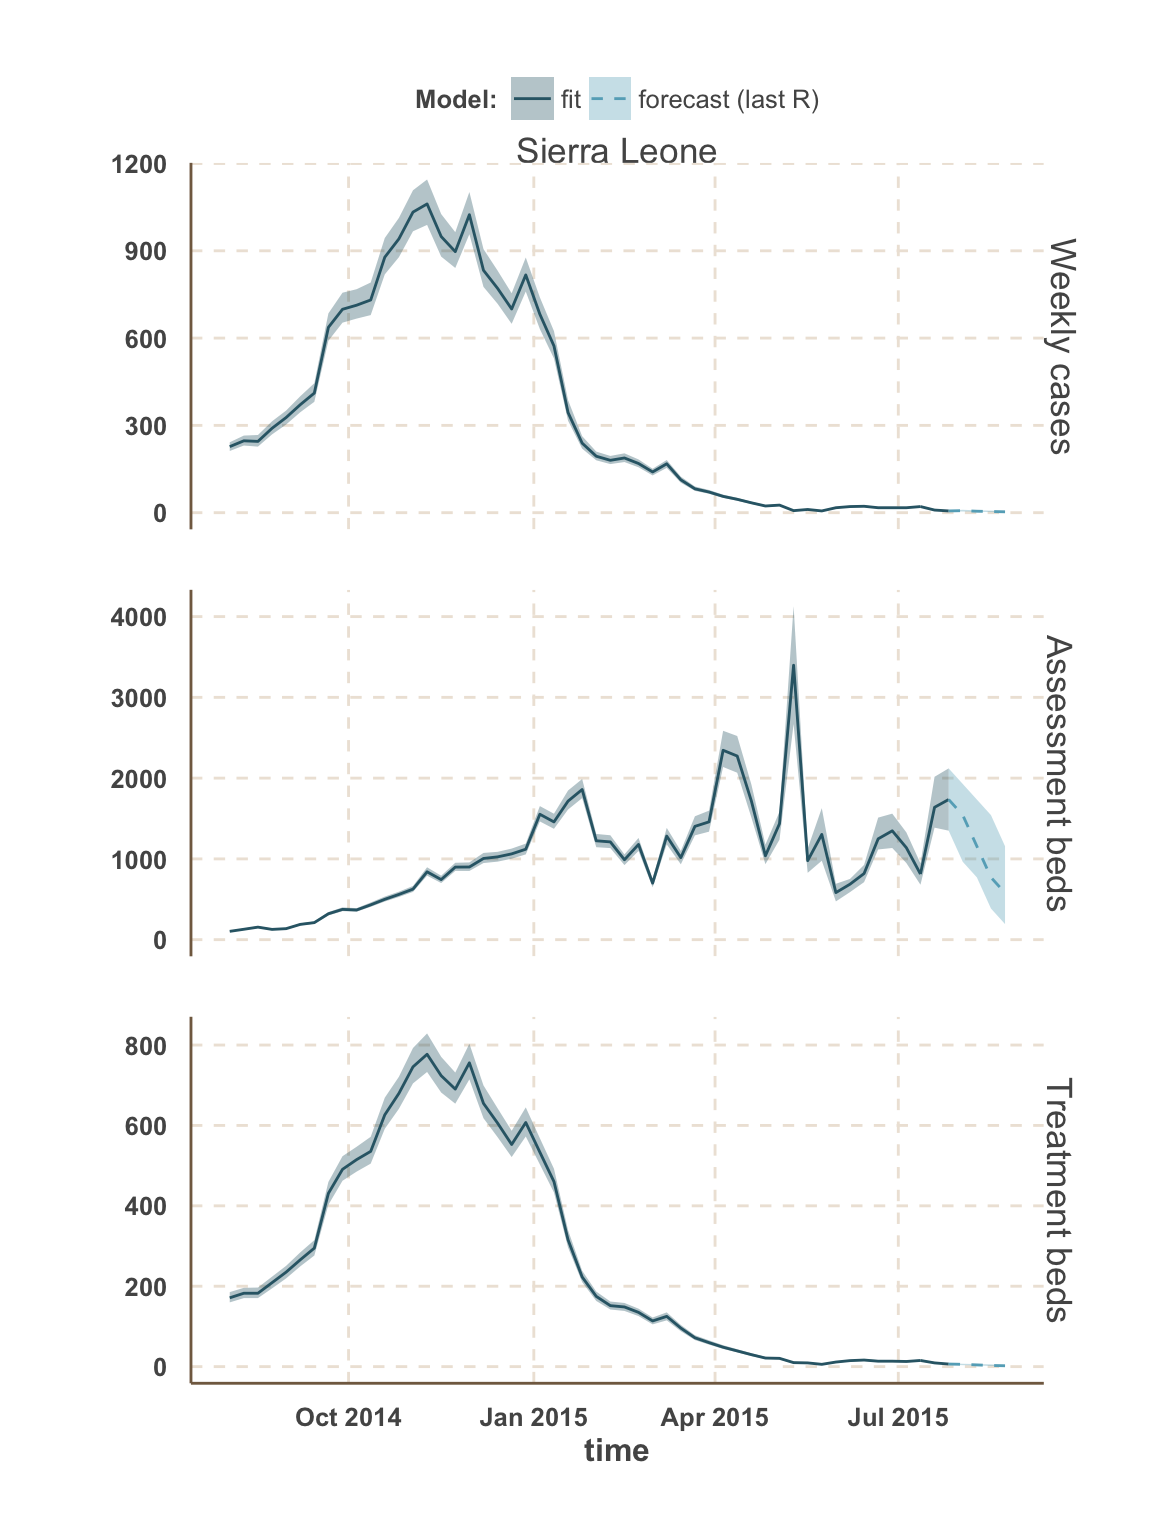
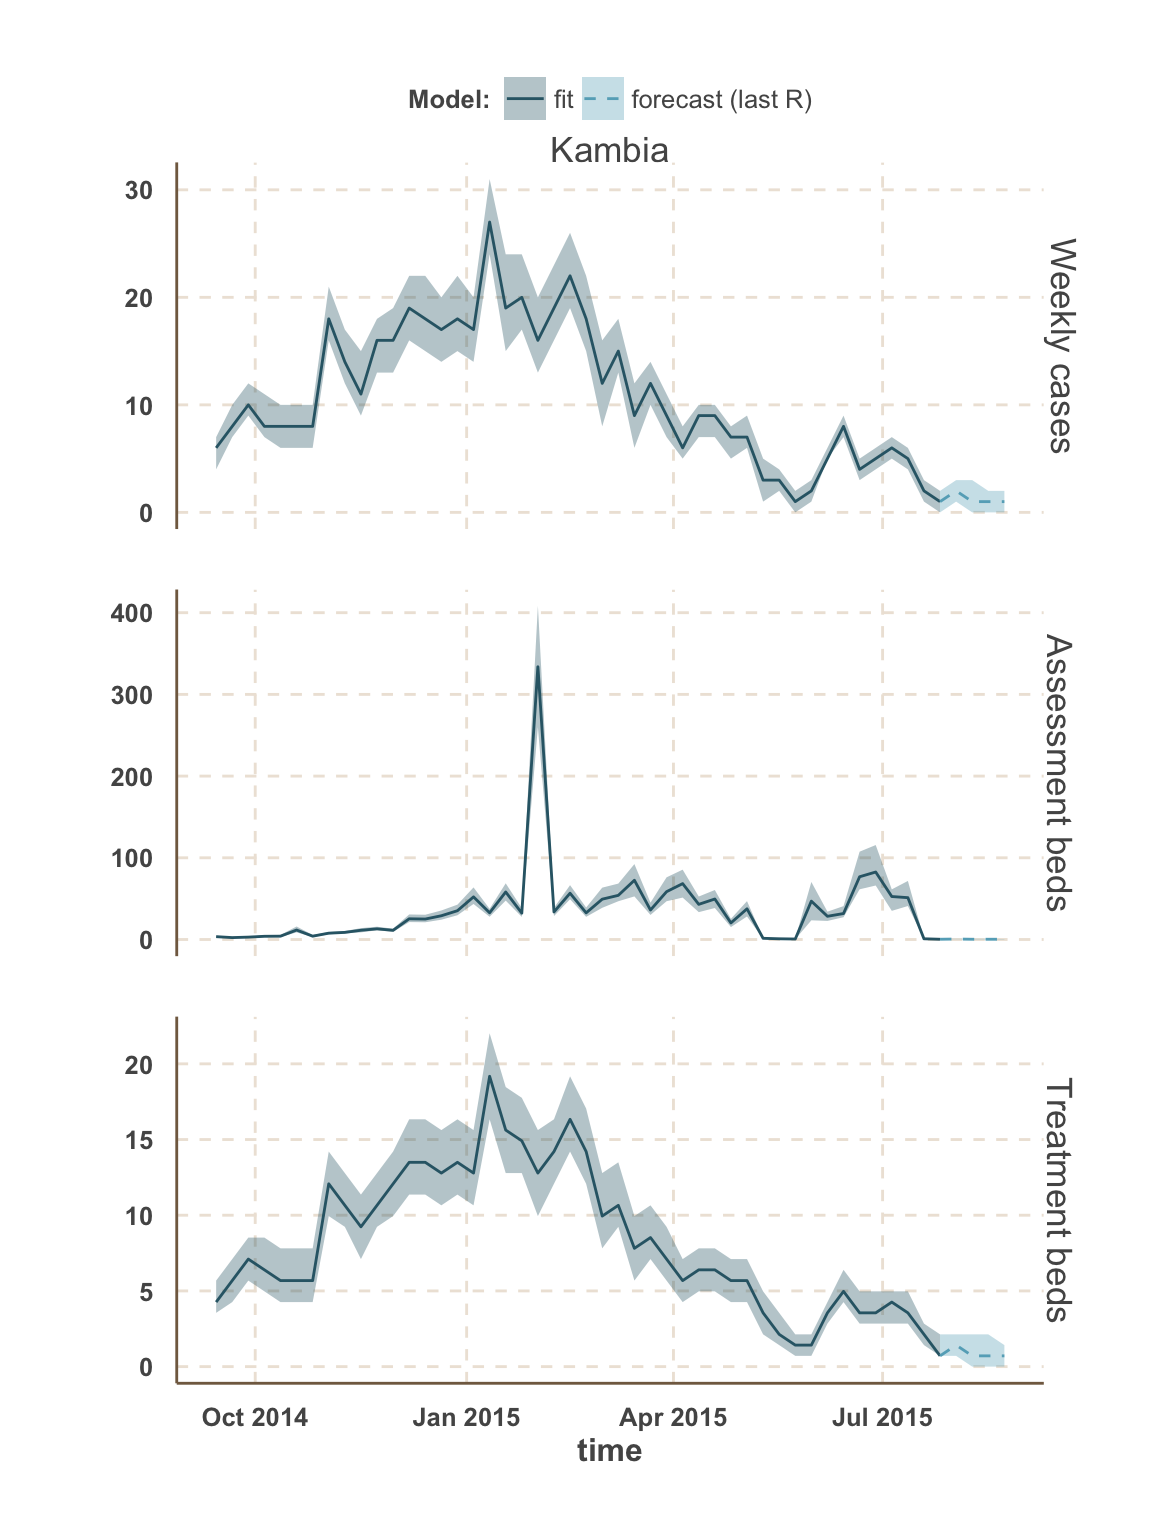
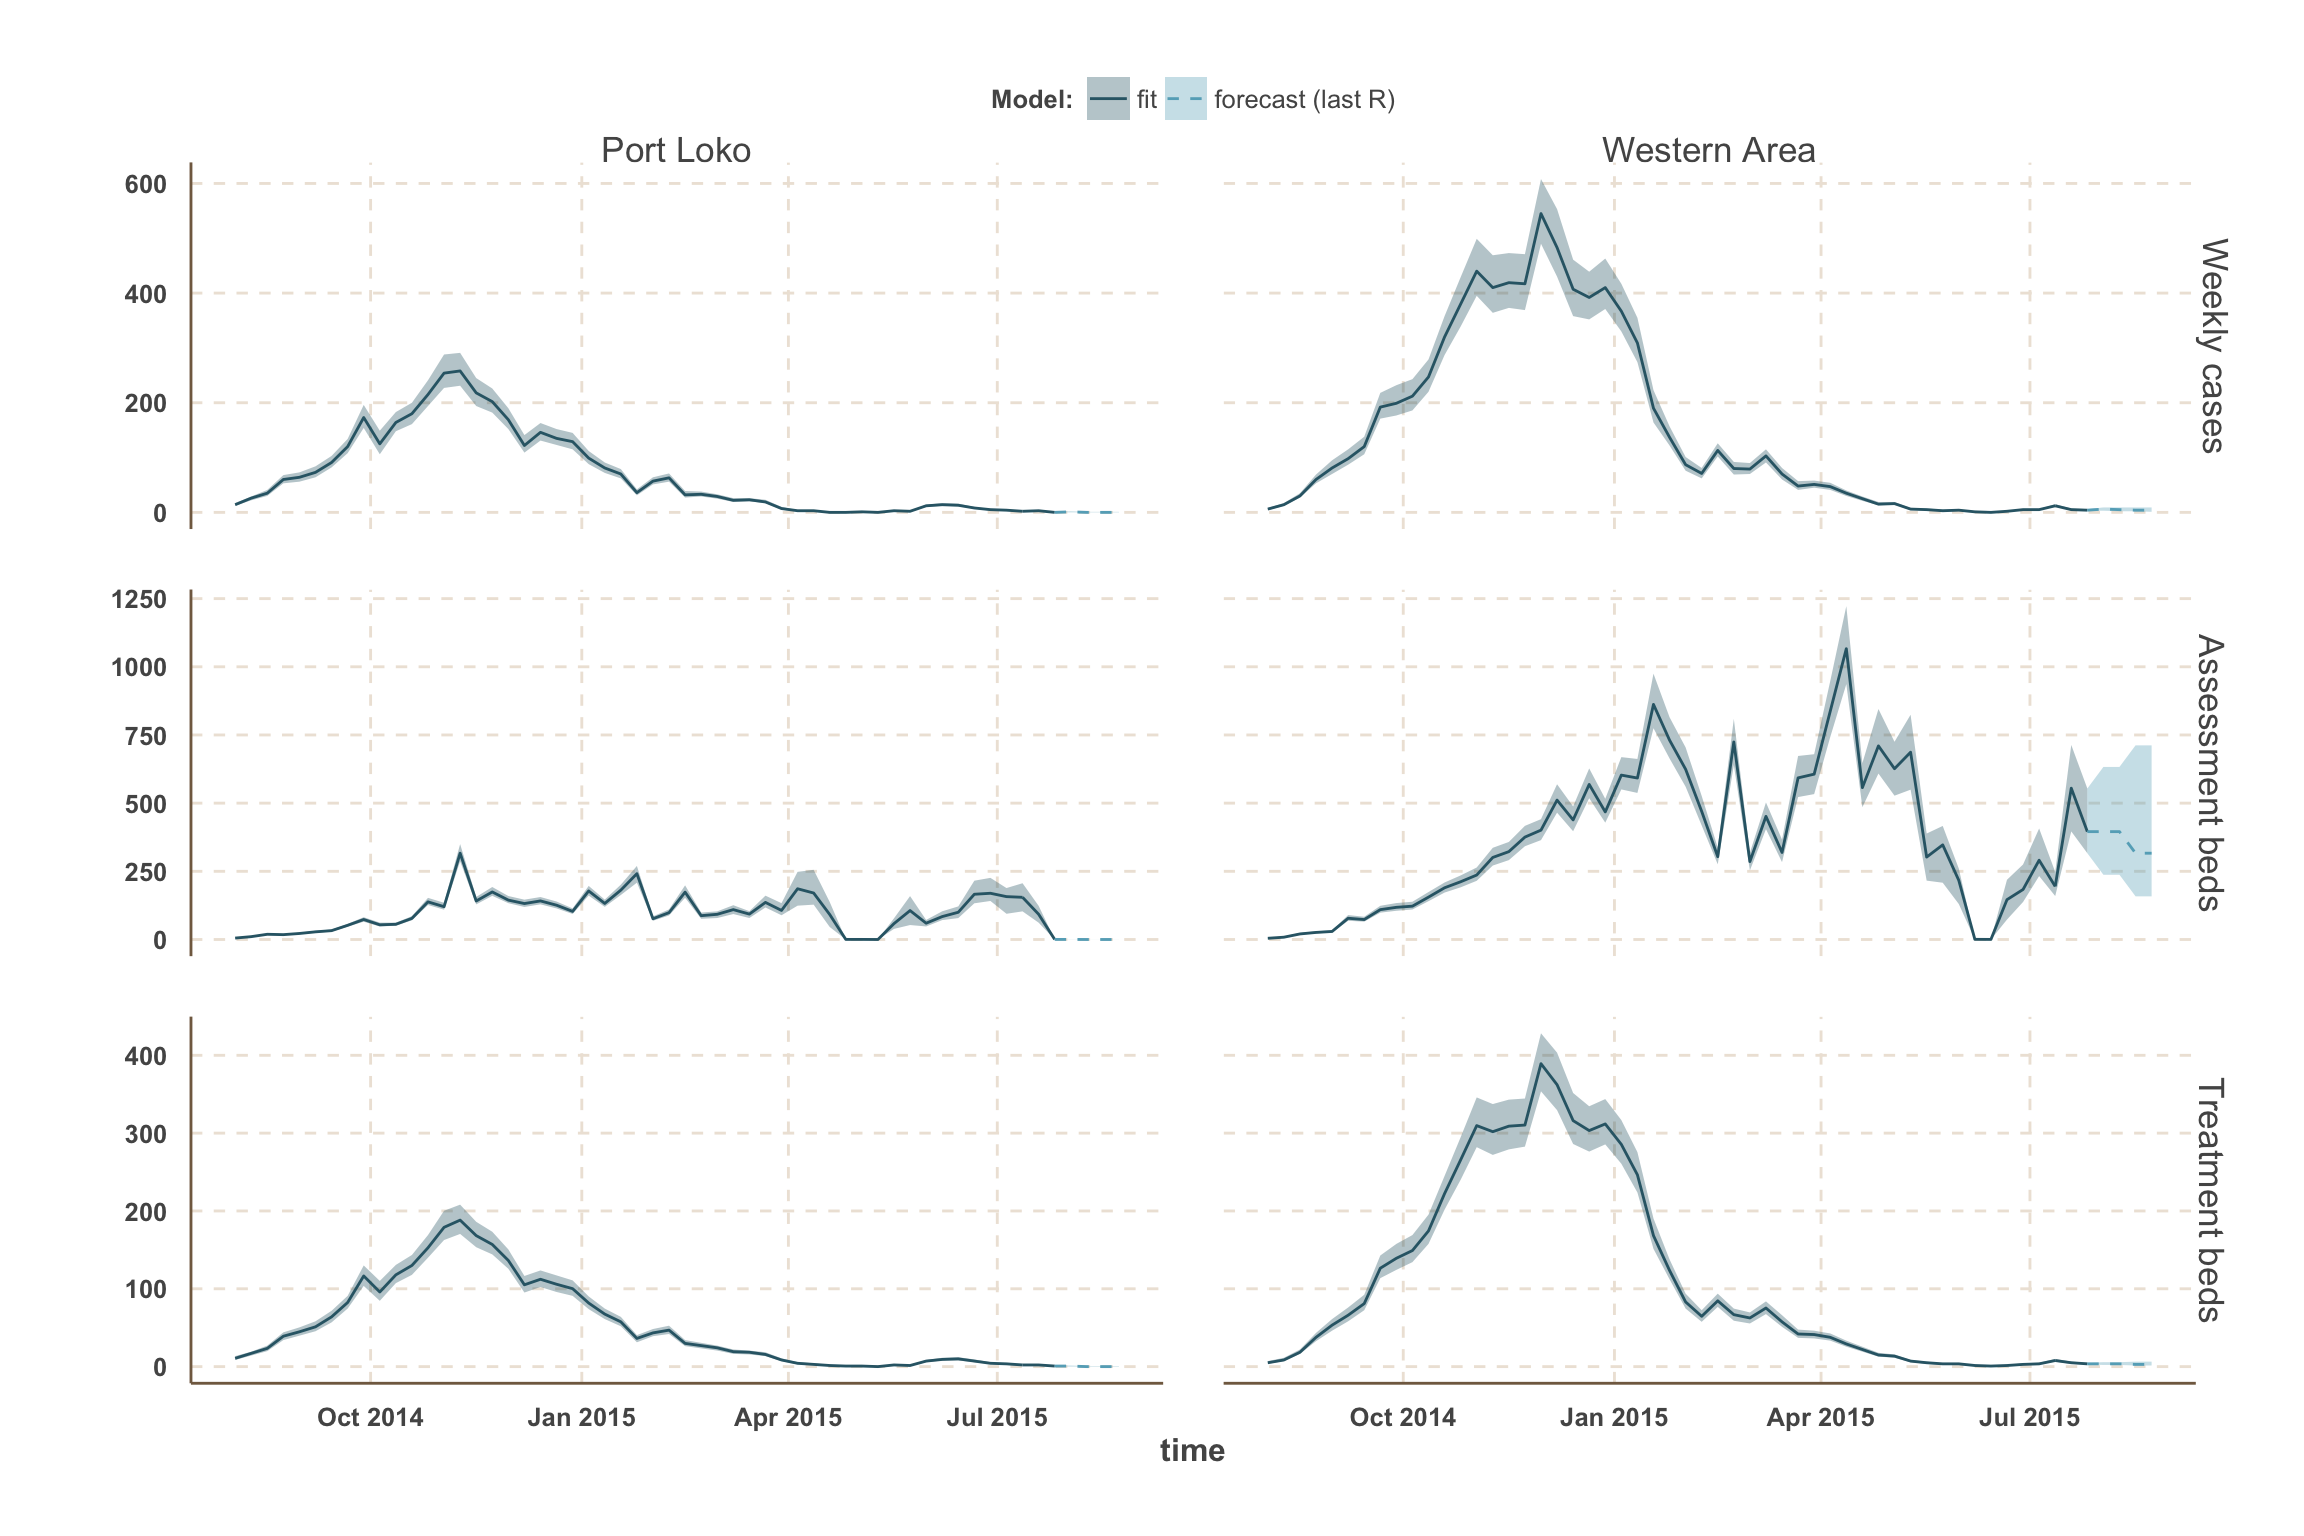
Forecast: cases & bed demand
- The fitted model was used to simulate 3000 stochastic trajectories from 26 July (last fitted data point) until 23 August.
- Each simulation started with a different value of \(R_t\) sampled from the posterior distribution averaged over the last three data points in order to smooth over recent changes.
- We present projections of weekly number of cases. This is different than the number of reported cases due to under-reporting.
- We also present projections of bed demand (assuming that all Ebola cases seek health-care).
- Bed demand is separated between assessment and treatment.
- Upon notification, Ebola suspected cases occupy an assessment bed (Holding Centers, Community Care Centers and Treatment Centers) until status confirmation.
- The number of assessment beds required is equal to the number of cases in their first 3 days post-notification (average time to obtain status result), while accounting for the number of non-Ebola cases awaiting for status result (around 30% of suspected cases).
- Upon confirmation, Ebola cases are transfered to a treatement bed (Treatment Centers) where they may die or recover.
- The number of treatment beds required is equal to the number of cases confirmed but not yet removed. This corresponds to a mean hospitalisation time of around 4 days.
Guinea
Sierra Leone
Tables of bed demand
Guinea
All Guinea
| week ending | incidence | assessment beds | treatment beds |
|---|---|---|---|
| 02 Aug 2015 | NA | 13 | 18 (13 - 24) |
| 02 Aug 2015 | NA | 15 | NA |
| 02 Aug 2015 | 10 (8 - 14) | 8 | NA |
| 09 Aug 2015 | NA | 12 | 18 (12 - 25) |
| 09 Aug 2015 | NA | 14 | NA |
| 09 Aug 2015 | 10 (7 - 15) | 7 | NA |
| 16 Aug 2015 | NA | 11 | 18 (11 - 26) |
| 16 Aug 2015 | NA | 13 | NA |
| 16 Aug 2015 | 10 (7 - 15) | 7 | NA |
| 23 Aug 2015 | NA | 10 | 17 (10 - 27) |
| 23 Aug 2015 | NA | 12 | NA |
| 23 Aug 2015 | 10 (6 - 16) | 6 | NA |
Forécariah
| week ending | incidence | assessment beds | treatment beds |
|---|---|---|---|
| 02 Aug 2015 | 3 (2 - 4) | 2 | NA |
| 02 Aug 2015 | NA | 3 | 5 (3 - 8) |
| 02 Aug 2015 | NA | 4 | NA |
| 09 Aug 2015 | 2 (1 - 4) | 1 | NA |
| 09 Aug 2015 | NA | 2 | 4 (2 - 8) |
| 09 Aug 2015 | NA | 3 | NA |
| 16 Aug 2015 | 2 (1 - 4) | 1 | NA |
| 16 Aug 2015 | NA | 2 | 4 (2 - 7) |
| 16 Aug 2015 | NA | 3 | NA |
| 23 Aug 2015 | 2 (1 - 4) | 1 | 3 (1 - 7) |
| 23 Aug 2015 | NA | 2 | NA |
Sierra Leone
All Sierra Leone
| week ending | incidence | assessment beds | treatment beds |
|---|---|---|---|
| 02 Aug 2015 | 5 (3 - 7) | 3 | NA |
| 02 Aug 2015 | NA | 5 | NA |
| 02 Aug 2015 | NA | 960 | 1,500 (960 - 1,900) |
| 09 Aug 2015 | 4 (2 - 7) | 2 | NA |
| 09 Aug 2015 | NA | 3 | NA |
| 09 Aug 2015 | NA | 770 | 1,200 (770 - 1,900) |
| 16 Aug 2015 | 4 (2 - 6) | 2 | NA |
| 16 Aug 2015 | NA | 3 | NA |
| 16 Aug 2015 | NA | 580 | 1,200 (580 - 1,700) |
| 23 Aug 2015 | 3 (2 - 5) | 2 | NA |
| 23 Aug 2015 | NA | 580 | 960 (580 - 1,500) |
Kambia
| week ending | incidence | assessment beds | treatment beds |
|---|---|---|---|
| 02 Aug 2015 | 1 (0 - 2) | 0 | 0 (0 - 0) |
| 02 Aug 2015 | NA | 1 | NA |
| 09 Aug 2015 | 0 (0 - 2) | 0 | 0 (0 - 0) |
| 16 Aug 2015 | 0 (0 - 2) | 0 | 0 (0 - 0) |
| 23 Aug 2015 | 0 (0 - 1) | 0 | 0 (0 - 0) |
Port Loko
| week ending | incidence | assessment beds | treatment beds |
|---|---|---|---|
| 02 Aug 2015 | 0 (0 - 1) | 0 | 0 (0 - 0) |
| 09 Aug 2015 | 0 (0 - 0) | 0 | 0 (0 - 0) |
| 16 Aug 2015 | 0 (0 - 0) | 0 | 0 (0 - 0) |
| 23 Aug 2015 | 0 (0 - 0) | 0 | 0 (0 - 0) |
Western Area
| week ending | incidence | assessment beds | treatment beds |
|---|---|---|---|
| 02 Aug 2015 | 3 (2 - 5) | 2 | NA |
| 02 Aug 2015 | NA | 240 | 400 (240 - 630) |
| 02 Aug 2015 | NA | 3 | NA |
| 09 Aug 2015 | 4 (2 - 7) | 2 | NA |
| 09 Aug 2015 | NA | 320 | 470 (320 - 790) |
| 09 Aug 2015 | NA | 4 | NA |
| 16 Aug 2015 | 4 (2 - 8) | 2 | NA |
| 16 Aug 2015 | NA | 320 | 550 (320 - 950) |
| 16 Aug 2015 | NA | 4 | NA |
| 23 Aug 2015 | 5 (2 - 11) | 2 | NA |
| 23 Aug 2015 | NA | 320 | 630 (320 - 1,300) |
| 23 Aug 2015 | NA | 4 | NA |
Limitations
- Our model uses a time-varying \(R_t\) to capture the overall change of the reproduction number.
- Such changes are due to community behaviour, burial practice and control interventions.
- However, our model doesn’t explicitly account for the mechanistic effect of these different source of change. Rather it is a phenomenological description of their overall effect.
- We assumed that the time from onset to hospitalisation didn’t change over time. Decreasing the time to hospitalisation would reduce \(R_t\) but in the same time would require more beds as cases should stay longer isolated.
- Our forecast assumes that no intervention is implemented to reduce the reproduction number below what is inferred from the last three data-point (i.e. the situation remains broadly unchanged).
- Our analysis assumes that only 60% of the Ebola cases are reported in the data.
- If the actual number of cases reported is much lower, then our model under-estimates the number of true cases and thus of beds needed.
- Conversely, if the reporting rate is much higher than 60%, then our estimates should be seen as conservative.
Acknowledgement
Research team
- Anton Camacho (Research Fellow at LSHTM) & Sebastian Funk (Lecturer at LSHTM) performed data cleaning, extraction and analysis.
- Beth Smout, Rebecca Glover, Tim Pollington (Research Assistents at LSHTM), Lisa Knight (Medical Student at King’s College) and Julia Carney (MSc Student at LSHTM) performed data cleaning and extraction.
- We are grateful to Prof. Bernard Cazelles (UPMC) for access to the computational ressource and to Joseph Dureau (Snips) for useful advices on the use of the SSM library.
- We are also grateful to Etienne Gignoux (Epidemiologist at Epicentre), Dr Boubacar Diallo (WHO Guinea) and Prof. René Migliani (Conseiller du coordinateur national de la lutte contre Ebola en Guinée) for providing the Liberian and Guinean SitReps.
Funding
- This project (#13165) is funded by the Research for Health in Humanitarian Crises (R2HC) Programme, managed by Research for Humanitarian Assistance (ELRHA).
- The R2HC programme aims to improve health outcomes by strengthening the evidence base for public health interventions in humanitarian crises. Visit www.elrha.org/work/r2hc for more information.
- The £8 million R2HC programme is funded equally by the Wellcome Trust and DFID, with Enhancing Learning and ELRHA overseeing the programme’s execution and management.
References
1. WHO Ebola Response Team (2014) Ebola Virus Disease in West Africa — The First 9 Months of the Epidemic and Forward Projections. New England Journal of Medicine.
2. Dureau J, Kalogeropoulos K, Baguelin M (2013) Capturing the time-varying drivers of an epidemic using stochastic dynamical systems. Biostatistics.
3. Dureau J, Ballesteros S, Bogich T (2013) SSM: Inference for time series analysis with State Space Models. arXiv. Available at: http://arxiv.org/abs/1307.5626v4.